ALPHA GROWTH CAPITAL
  • Home
  • Portfolio
  • Services
  • Free Resources
    • Macro Economic Models ​
    • S&P500 Performance Indicator
    • Historical Data
    • AGC Monthly Newsletter
  • Join Us
  • Articles
  • Contact Us
  • Terms & Conditions

Sharing Our Thoughts

Modeling the Fair Value of the S&P500

11/12/2020

Comments

 
Large and small investors are quite often faced with the question: where is the equity market heading? Generally speaking nobody knows what will happen tomorrow or in a year from now. I am confident that any of the reader did not come across the idea of world lockdown prior this COVID pandemic.

What we know is that the market is influenced by factors like GDP, treasury rates, inflation and so on. For instance, it is given that when the GDP grows, all other factors being equal, then the equity market goes up. The question then becomes: how much?

In this article, I am showing that the S&P500 can be modeled as function of the main macroeconomic parameters of the USA economy. These factors are: gross domestic product (GDP), money stock index (M1), BAA corporate bond yield relative to 10 year Treasury bond (BAA-10Y) and consumer price index (CPI).
​
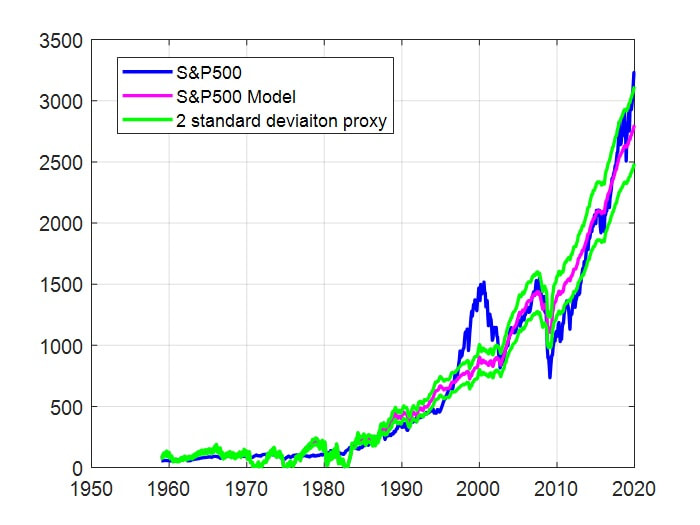
In Figure 1, the actual and modeled S&P500 index is presented. The model uses monthly data tracing back to the 1960’s. The model has an accuracy of 95.72%; R2. The 2 standard deviation of the error has been calculated to be 10.48%. The error is defined as the relative difference between actual and modeled value.
Picture
Figure 1: Actual and modeled S&P500 index.

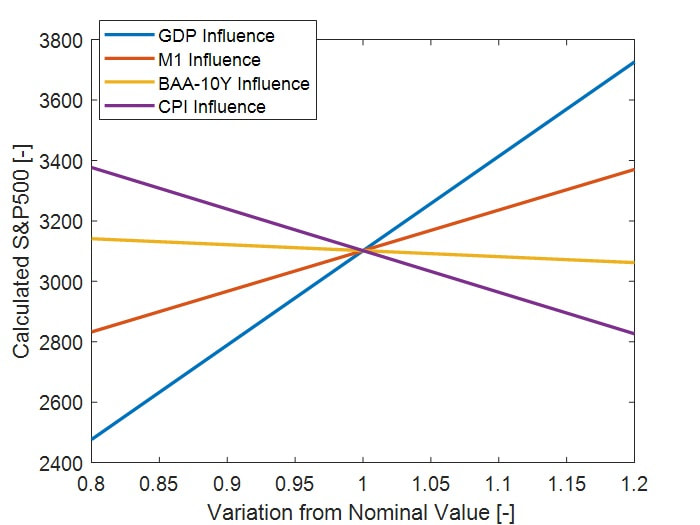
In Figure 2, it is shown how these four macro-economic variables are affecting the value of the S&P500. The variables were varied one at the time ±20% from their reference value. The reference value was assumed to be the one available on fred.stlouisfed.org at the end of November 2020.
​
If an analyst and/or an investor are interested in understand where the market is heading in e.g. one year from now, this model can be used to create outlooks based on estimations of future values of: GDP, M1, BAA-10Y and CPI.

The next question that might come to mind is whether the predictions are robust. To answer this question we need to keep two things in mind. First, the prediction is heavily dependent on the guess of the future value of the variable. If the guess is off then the prediction will be off. Second, this is a neutral model. Geopolitical events and buyers/sellers momentum are not accounted. If for any reason the GDP goes down and investors keep on heavily buying equities then the market will trend higher instead of going down as the model would have estimated.
Picture
Figure 2: Calculated S&P500 as function of macro-economic variables variations from their end of November 2020 values.
​

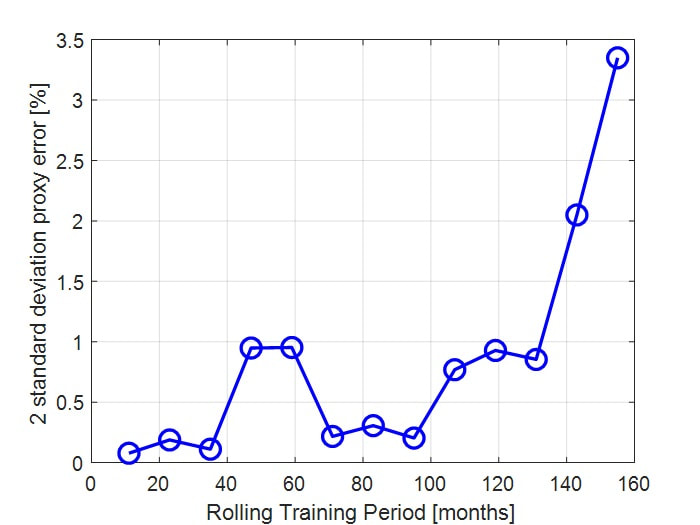
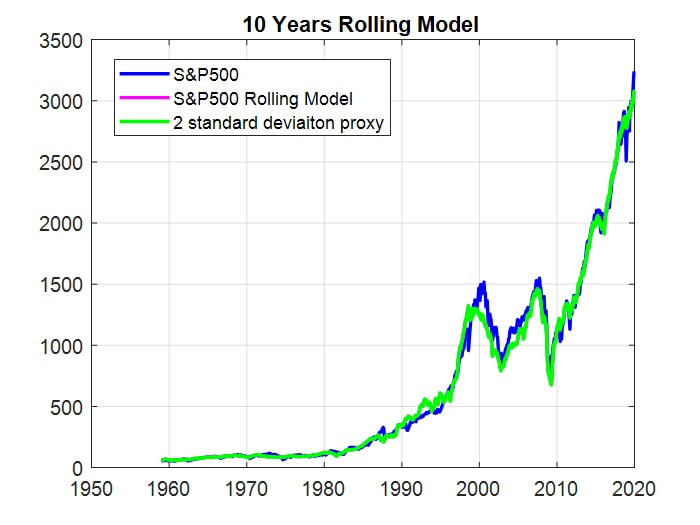
How to include geopolitical and market sentiment? The approach that was used in this work has been to calculate the coefficients of the model recursively. Figure 3 shows the accuracy of the model as a function of the rolling sample size. Each sample is equivalent to one month. As it can be observed, by having a smaller rolling training period the accuracy of the model improves. 733 samples (the entire time series) has an accuracy of 10.48%, with 120 samples (10 years), the accuracy is as low as 1%. This latest case is shown in Figure 4. With an improved in accuracy, such approach can be used to assess whether the market is fairly valued both based on fundamentals as well as other factors such as investor sentiment. Based on such information investors might decide whether to take a direction bet. Alternatively, as in the previous case, it can be used for short term outlooks.
Picture
Figure 3: Model error as function of the number of samples used to train the model.
Picture
Figure 4: Actual and modeled S&P500 index. The modeled S&P500 was created using a rolling regressive approach with 120 samples (10 years).
​

Concluding, the two models presented in this article are able to fairly well reproduce the trend of the S&P500. The second one does a better job since it also takes into account the market dynamic on top of macro-economic factors. The models can not predict where the market is heading, the future is not written. Despite they might be able to provide insights on how far off is the fair value of the market in relation to its actual value or alternatively they might be able to indicate where the market might head based on short term estimations of the economy. 
Comments

    ​Join our monthly newsletter, it is free!

    At the beginning of the month, we send out an email reviewing the performances of NEXT-alpha, provide the S&P500 and Gold outlooks based on our proprietary models and reviewing the current economic environment. ​
Subscribe to Newsletter

Subscription*​

Suitable for individuals that would like to implement the strategy themselves in their brokerage account.
​
It is only 37.5 USD/month! To subscribe Contact us!
​

Separately Managed Account

Suitable for investors with at least $20,000 to invest that would like Alpha Growth Capital to manage the asset on the client behalf.

Trades and performances are reported in real time, the client has the intraday liquidity, the funds are held with Exante and there is no lock-up period.

​Want to know more? Contact us!
​
SMAs are only provided to certain countries. 

The information, analysis, data and articles provided in this and through this website are for informational purpose only. Nothing should be considered as an investment advice. Alpha Growth Capital LLC does not make any recommendation to buy, sell or hold any security or position. The website and information provided through it are marketed “as is”. There is no guarantee that anything presented and provided on this and through this website is complete, accurate and correct. Relying on the information provided on this website and through its communication channels is done entirely at the individual own risk. The owner of Alpha Growth Capital is not a registered investment advisor under any security law and nothing provided in this and through this website should be interpreted as a solicitation to buy, hold or sell any mentioned financial product or service. Past performance is not indicative of future results. Any financial decision is at the sole responsibility of the individual.
​

By navigating in this website, you agree to its Terms & Conditions
​
  • Home
  • Portfolio
  • Services
  • Free Resources
    • Macro Economic Models ​
    • S&P500 Performance Indicator
    • Historical Data
    • AGC Monthly Newsletter
  • Join Us
  • Articles
  • Contact Us
  • Terms & Conditions