|
I am writing this brief article after having carried out an analysis on whether it is worth to allocate part of the NEXT-alpha portfolio to option trading. I got interested in options because they allow us to mathematically quantify the probability of success of a trade. By knowing how much we can lose (assuming we take a risk defined trade), how much we can win and the success rate of the trade, we can then estimate the long term rate of return of our portfolio. Somewhat like it happens in Las Vegas, the only difference is that this time we can be the casino. The subject is to say the least vast. In this article, I am briefly scratching the surface and apologies if not enough context is provided with some of the terminology used hereafter. I like to keep things simple and reduce the number of the moving parts. Is there an option strategy that fit all the cases? Short answer is: no. Option strategies can be seen as a toolbox: for any situation then there is an optimal strategy. You can find out more on how to match market environment and optimal option strategy in here https://optionalpha.com/library/ultimate-options-strategy-guide and here https://www.vtsoptions.com/trade-types. To minimize the complexity of the problem, I said to myself: if I have no view on the direction of the market, if I want to take a risk defined strategy and if I want to know a priori the success rate of my trade, what strategy should I use? After lot of munching, my conclusion was the Credit Iron Condor. Premium can be collected with the passage of time, the risk is defined when the trade is set up, it has no directional bias and the probability of success is normally set at 70%. Can I use it in any situation? Nope. I need to make sure that the rank of the implied volatility of the underlying asset is elevated enough to make sure that there is premium to collect; i.e. our potential profit. How to set up an Iron Condor trade? You can read more in here: https://optionalpha.com/strategies/iron-condor. In short: a put and a call options with a delta of 15 are sold. While a put and a call options are bought at a strike price slightly lower and higher respectively as compared to the put and call options that have been short sold. Typically the expire date is chosen to be: 30 to 60 days. Selecting the delta at 15 ensures that the probability of success of the trade is ca. 70%. A typical Profit/Loss diagram at expiration for an Iron Condor trade looks like as in Figure 1. Typically the number of contracts is chosen so that the max loss is set at 1 to 2.5% of the portfolio AUM. Quite often for many, this does not look a good trade. This is because when looking at the payoff diagram, the max loss could be 2 to 5 times higher than the max gain. Why to even enter such trade? Figure 1 shows the PnL at expiration. In reality the PnL as function of the strike price evolves over time. In Figure 2, the blue line represents the PnL when the trade opens while the orange line, the PnL at expiration. Over time, the blue line converges towards the orange because of the theta decay. The theta decay is the loss of value of the option per day. Because the strategy sells a put and a call option with a delta of 15, the trade takes advantage of this decay. When trading the Iron Condor, the trade is exited when the sum of the Profit/Loss of the 4 options is equal to plus/minus 50% of the maximum potential profit. As result, for a trader, the max gain is equal (minus fees) to the max loss. 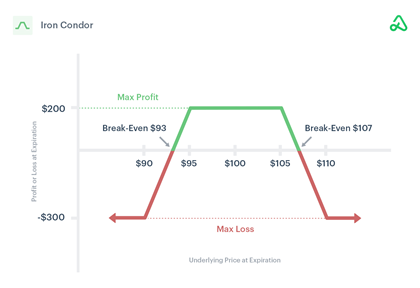 Figure 1: Credit Iron Condor profit and loss at option expiration as function of underlying asset strike price. Source: Option Alpha. 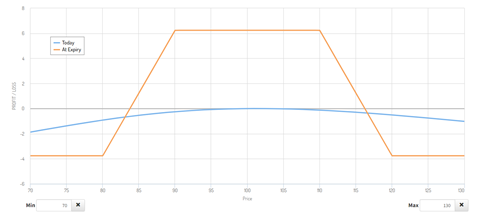 Figure 2: Credit Iron Condor profit and loss at option expiration and opening as function of underlying asset strike price. Source: Option Creator. Moving forward to the item that matter the most: how to compute the long term return of investment and associated risk? The way I did it was to evaluate a multitude of pay-off diagrams for a large number of uncorrelated asset classes. For simplicity in here, I’ll report the calculations I did using the S&P500 options (SPX) expiring on May 20, 2022. The table below shows the contracts that were purchased. 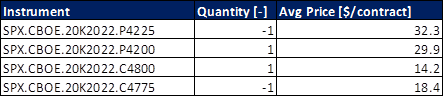 The maximum potential loss was calculated to be $1,590 while the max potential gain $660. A stop loss and a take profit are then set at plus/minus 50% of $660. Assuming $16.8 round trip fees for 4 contracts (yes, the fees are high in Europe), this equates to a max loss of $346.8 and $313.2. Assuming that the trade was opened having in the account an amount equal to the max loss then the max potential gain and loss for this trade is: 19.70 and -21.81% respectively. We now know that the probability of success of the trade is 70%. As result the long term average return of such trade will be in the ballpark of 7.25% (70%*19.70% minus (100%-70%)*21.81%). Say that 24 of such trades are made per year then the long term CAGR would be 173.89%. Good, right? Not so fast. Imagine that the 30% of the loosing trades are realized one after the other, then the portfolio would experience a drawdown of 83% ((1-21.81%)^(24*30%)-1). Something has to be done.
Two actions can be taken:
The first action will reduce the drawdown of the entire portfolio. Allocating 7.5% of the AUM, in the very worst case can lead to a maximum drawdown of the portfolio of 11.78%. The second action will reduce the probability of having several consecutive loosing trades. It is important not to exceed an allocation per trade in the ballpark of 1 to 2%. As result, the number of uncorrelated assets to have at disposal for trading should be at least 5 to 10 thickers. In my watch list I have: US equities, gold, wheat, corn, US T-bonds, crude oil and natural gas. The selection was based on the fact that these assets are uncorrelated or loosely correlated and my familiarity with these (I have been looking at these numbers daily for at least 6 years). Putting the numbers together and incorporating all these actions, we can then expect a long term CAGR of 13.04% in the entire portfolio solely trading Iron Condors while a maximum drawdown of 11.78%. In my opinion this is acceptable and could be implemented in the NEXT-alpha umbrella strategy. At the moment of the writing a front test on a real account is on-going. Ready to be implemented full scale if the practice will mirror the theory. Keep in mind that trading option is very risky if you do not fully understand what you are doing. Even starting from something as simple as placing the order. If you want to get in this domain, it is better you practice (a lot) in the demo account first. It can be rewarding. |
|
|
Questions?Contact us here.
DisclaimerThe information, analysis, data and articles provided in this and through this website are for informational purpose only. Nothing should be considered as an investment advice. Alpha Growth Capital does not make any recommendation to buy, sell or hold any security or position. The website and information provided through it are marketed “as is”. There is no guarantee that anything presented and provided on this and through this website is complete, accurate and correct. Relying on the information provided on this website and through its communication channels is done entirely at the individual own risk. There is no registration as investment advisor under any security law and nothing provided in this and through this website should be interpreted as a solicitation to buy, hold or sell any mentioned financial product or service. Past performance is not indicative of future results. Any financial decision is at the sole responsibility of the individual.
By navigating in this website, you agree to its Terms & Conditions |