|
Looking at the past Historically gold coinage was widely used as currency. When paper money was introduced, it typically was a receipt redeemable for gold coin or bullion. In a monetary system known as the gold standard, a certain weight of gold was given the name of a unit of currency. For a long period, the United States government set the value of the US dollar so that one troy ounce was equal to $20.67, but in 1934 the dollar was devalued to $35.00 per troy ounce. On 17 March 1968, economic circumstances caused the collapse of the gold pool, and a two-tiered pricing scheme was established whereby gold was still used to settle international accounts at the old $35.00 per troy ounce but the price of gold on the private market was allowed to fluctuate; this two-tiered pricing system was abandoned in 1975 when the price of gold was left to find its free-market level. After 15 August 1971 Nixon shock, the price began to greatly increase, and between 1968 and 2000 the price of gold ranged widely. In late 2009, gold markets experienced renewed momentum upwards due to increased demand and a weakening US dollar. Gold further rallied hitting new highs in May 2010 after the European Union debt crisis prompted further purchase of gold as a safe asset [edited from: https://en.wikipedia.org/wiki/Gold#Price]. Why to value gold? Gold is perceived as a safe asset to protect capital during: equities market downturns, periods of inflation and periods of stagflation. Understanding how its price might move in relationship to the equity market and inflation might help the investor to identify opportunities. Modeling the gold price Traditionally commodities prices depend on the law of supply, demand and inventories. Too much supply and the price will go down and vice versa. When it comes to gold, the situation is somewhat different. Because gold is perceived as safe heaven against inflation and bad economy, its price is mostly affected by the valuation of the equity market, consumer price index and money in circulation (the last two directly proportional to the level of inflation). Regression was used to model the fair value of gold. Three inputs were used: S&P500 value, USA money stock and USA consumer price index. Regressing these three factors against monthly gold price, using more than 20 years of data, yields to a fairly good fit (i.e. 0.77 R2). Like in the case of the S&P500 fair value model, we must keep in mind that these models are not predictive. An action must take place (i.e. actual value of the three inputs) for a reaction to happen (i.e. gold price). 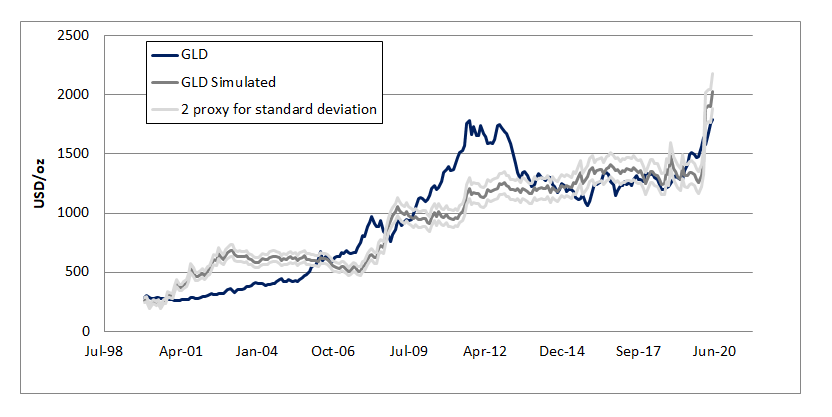 The next question that comes to mind is: where is the gold price heading? Because the gold price is affected by the equity market valuation, first we need to understand where the equity market might head. To do that, the model of the S&P500 presented in one of the Alpha Growth Capital previous articles is used. From a fundamental perspective (GDP, CPI, money stock and corporate-treasure yield spread), the S&P500 looks to be overvalued between 14 and 28% (as per September the 1st). 28% assuming that the current USA GDP is the same as the one reported in 20Q2 while 14% assuming the GDP being the same of 19Q4 (i.e. all the time high). 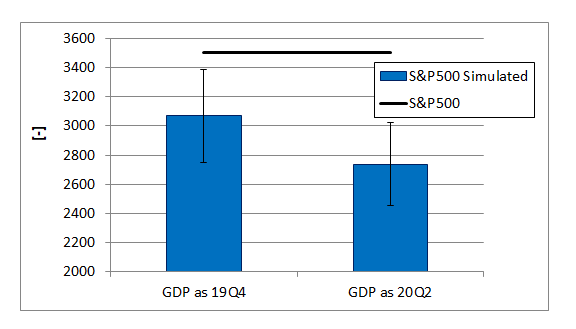 Given that now we have an overview of where the market might be heading, the gold price can be estimated for three different scenarios. Using the current value of the S&P500 (September the 1st), according to this model, gold is somewhat overpriced by ca. 6%. In the eventuality, the market would move lower to its estimated value, the yellow metal might reach 2081-2255 USD/oz (ca. 5 to 12% higher than the current value). 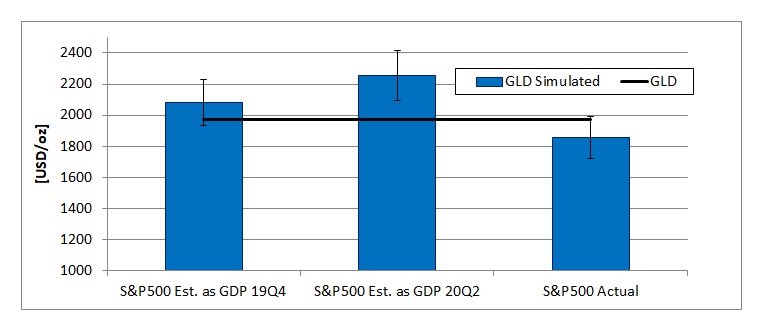 I hope the reader enjoyed the article. I would like to remind that this article is not an investment advice and there are no certainties that in the future the gold and S&P500 values will move as indicated by the models and presented in this post.
Diversification: does it really protect your money when you need it the most? If I am writing this article, it is because the short answer is: not quite, but… Let’s start explaining the concept of diversification and why we need it. Diversify your portfolio means to take uncorrelated assets and combine them together in such a way to be protected from excess drawdowns during equity market downturn while generating alpha in the long run. Typical long term uncorrelated assets from the S&P500 (SPY) are: emerging market equities (EEM), gold (GLD), bonds (TLT), agricultural commodities (DBA), energy (XLE),… There are several techniques to select the appropriate allocation; one of the simplest way to do it is the Risk Parity methodology. In theory this approach makes sense but what we must keep in mind is that the financial market is a very dynamic environment. As the chart below shows, the correlation coefficient (between different asset classes and the S&P500 dynamically calculated over a period of one month) substantially changes with the volatility of the market (VIX). In periods of lower volatility, the asset classes are somewhat uncorrelated from one another. When the volatility starts to spike (often associated with sudden pullback of the equity market), then most of the assets start to move in the same direction of the market (positive correlation). The only exceptions are: treasury bonds that move in the opposite direction (negative correlation) while gold is somewhat all over the place. What does that mean for the portfolio? Let’s say that the portfolio is statically diversified over the six different asset classes, as soon as the volatility starts to spike (market moving down), five assets out of six will also move down thus limiting the downside protection risk. The only savior is treasury bonds. 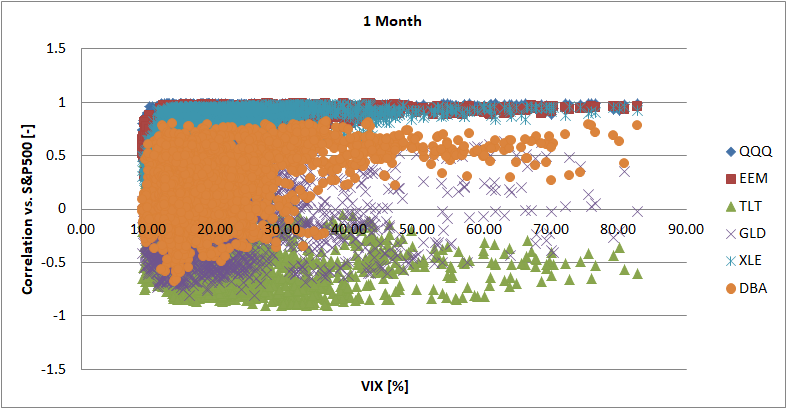 If bonds are the only way to protect the portfolio when the market goes south, while keeping in mind that over the long run equities have the best return, then diversification can be heavily simplified by investing solely in equities and bonds. There is a “but” to this: the splicing of the portfolio must be dynamic. In particular:
Moreover, if the profits should be maximized as much as possible:
Putting all this knowledge / steps together, we then get the dark blue time series. The light blue being the risk parity approach to the six different asset classes while the gray line is the benchmark. Compared to the benchmark, dynamically diversifying between equities and bonds allows: increase the overall return by 26% while reducing the max drawdown from 56 to 15%. Dynamic diversification of truly uncorrelated assets creates the real hedge against market downturns. The risk parity methodology applied to the six statically uncorrelated asset classes would have resulted in 12% lower return than the benchmark and 33% maximum drawdown. 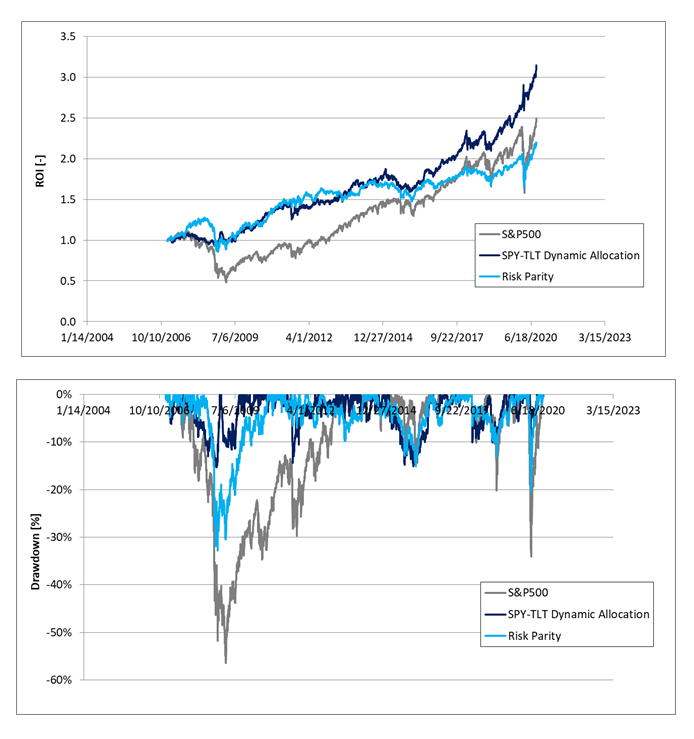 I hope you enjoy reading it and find the content useful.
Leave a comment if you would like to read more of these type of posts! By Andrew White, CFA and Alpha Growth Capital LLCFYI - Article was written on June 1, 2020, so is now out of date. Despite the market gaining about +5% in the week following, article conclusions still largely hold. How to Value the Market Amid Economic Wipe-out? In normal times, measures such as P/E ratio, dividend yield, or other traditional metrics are widely used to value the stock market. In abnormal times – such as the ongoing global pandemic resulting in the effective shutdown of huge parts of the national economy – traditional measures fall short. For how can you value stocks normally when there is no way to reliably estimate earnings and share dilution? Over last 60 years though, one method stood the test of time that does not depend on traditional inputs: regression. It too requires inputs, but they are sometimes more discernible than traditional measures. To wit, just four inputs rationally predict S&P 500 fair value: Gross Domestic Product (GDP), Money Stock (M1), corporate bond spread, and CPI. And we think markets discount earnings? Regressing these four factors against the monthly level of S&P 500 since 1959 (i.e. 60 years of data) yields a model with exceptional fit (i.e. 0.96 R2), credibility across factors/model itself (i.e. high t-stats and F-factor significance), and correlation/coefficient alignment. In other words, it is not coincidence and includes a range measure capturing most history (i.e. proxy for 3x standard deviation of residuals): 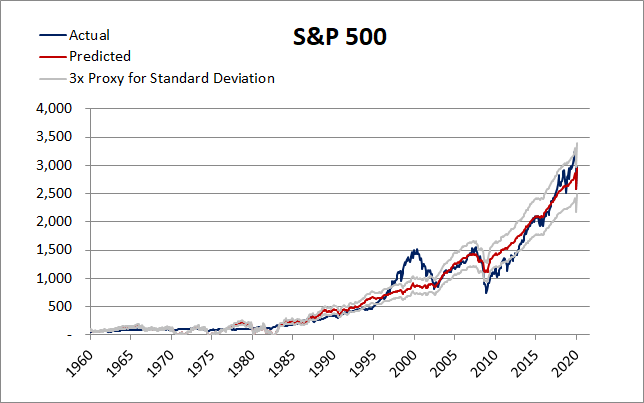 Fed Up
Given strong factor causation implied in the model above, it is natural to extrapolate the model forward to the end of 2020/beginning of 2021 amid the global lockdown to determine potential fair value level for the S&P 500. Amazingly, S&P 500 May-close value IS basically fair value re model (assumptions: -5% GDP, $6tn M1, 3% corp bond spread, -4% CPI over next 12 months). How? Federal intervention. Where does the market go from here then? To determine market trajectory, consider the future of Federal stimulus, given it was responsible for providing the bridge over 2020 valley. Considering a range of estimates for GDP, CPI, and corporate bond spread, it is possible to estimate how much money the Federal government must pump into the market/economy to obtain market highs (current M1 = $5tn): Scenario: V Economic Recovery The US economic machine effectively came to a near full stop for two months, now begins to re-open in a bumpy fashion, and the Federal Reserve does “what it takes” to permanently re-start the engine. Specifically, the following assumptions are made: ·12-month GDP change: -10% over next 12 months ·12-month Corporate - 10Y T-bond spread: 2.8% (long-term average + 1 standard deviation) ·12-month CPI change: -4% (maximum decline in 2008/09 economic contraction) ·12-month M1 level: $7.5tn (+$2.5tn more stimulus that translates down to M1 level) The question in this scenario is how much the federal government reacts, but react it is already clear they will. Exact level estimated is best left up to the stock market to predict. However, in this “V” scenario, the S&P500 is actually now 5% UNDER fair value (i.e. 3,200). If melt-up exuberance begins in earnest (i.e. valuation rises to proxy level for 3x standard deviation), S&P 500 has 20% upside to 3,600. Scenario: U or W Economic Recovery The economic recovery turns out to be deeper and more “U” or “W” as consumer spending does not return as fast as currently expected due to persistent unemployment and/or COVID 2nd wave. Thus, the Federal government and Federal Reserve inject vastly more stimulus. Specifically, the following assumptions are made: · 12-month GDP change: -15% over next 12 months · 12-month Corporate - 10Y T-bond spread: 4.4% (long-term average + 3 standard deviations) · 12-month CPI change: -8% (twice the maximum decline in 2008/09 economic contraction) ·12-month M1 level: $10tn (+$5tn more stimulus that translates down to M1 level) In short, bad - even horrific news - IS now a material positive for the S&P 500 as it effectively calls the federal government’s hand – in 2020 at least. In this “U or W” scenario then, the S&P500 is currently 10% UNDER fair value (i.e. 3,400). If a melt-up exuberance begins in earnest (i.e. valuation rises to proxy level for 3x standard deviation), S&P 500 has 30% upside to 4,000. Not a Question of Whether to Buy Right Now. Question is How Fast? According to our long-term regressed model for the S&P500, the S&P 500 incredibly is currently fairly valued. In an economic V recovery scenario, the market has potential for +5% to +20% upside all the way to 3,600. If an economic U or W recovery were to manifest, the S&P500 has potential for +10% to +30% upside all the way to 4,000. All…depending…on…the…federal…government. S&P 500 has risks: e.g. re-openings, earnings, China trade, COVID-19 2nd wave, election, and what comes after. Market valuation (currently or post-additional federal stimulus) though is NOT one. Indeed, material upside remains before valuation even becomes a concern, according to our regressed model. Little backstopped downside; meaningful future stimulus upside; wall of worry. Place your bets. The short answer I can give you is: I have no idea. My investments so far have been systematic and macro based. The market moves in a certain direction and the macro points towards the asset that is more likely to generate the highest return within the next 30 days. Despite, lot of folks have been talking about recession for at least the last couple of years. When the stock market reaches the all the time high, quite often we read of doomsday predictions right around the corner. A recession is defined by the GDP falling two consecutive quarters. Nothing in life or in the nature is coincidental. There is always some sort of cause-effect behind everything. The same applies to recession. Now if you want to get a better insights on how the economy machine works, I would recommend to watch this video from Ray Dalio; https://www.youtube.com/watch?v=PHe0bXAIuk0&t=1097s. The video is 30 minutes long and it provides a good overview of the bolts and nuts behind the economic machines. So it does about recession. If causes and effects can be clearly quantified, we can then think of creating a model and try to predict the next recession. I have tried to do that using a large part of the mechanics shown in the video. It was not easy and has you can see the model captures most of the recessions from 1929 to modern days, it misses the ones of 1945/48/53/60 and sometimes it predicts recession when (according to the standard definition) the GDP still goes up. Let’s imagine that this model would been available to us back in 1928 (use lot of imagination) and then we would have bought the S&P500 when the probability of a recession is below 50% while going cash when the probability is above 50%. By now we should have managed to achieve a CAGR of 7.47% with a max drawdown of 51%. Buying & holding the S&P 500, we would have made 6.81% with a max drawdown of 86%. 0.66% might not seem much but if you would have invested $1 in 1928 by now it would have grown to $433 vs. the $129 of the buy & hold approach. Every drop counts. Going back to the original question: is a recession around the corner? No, according to the model. 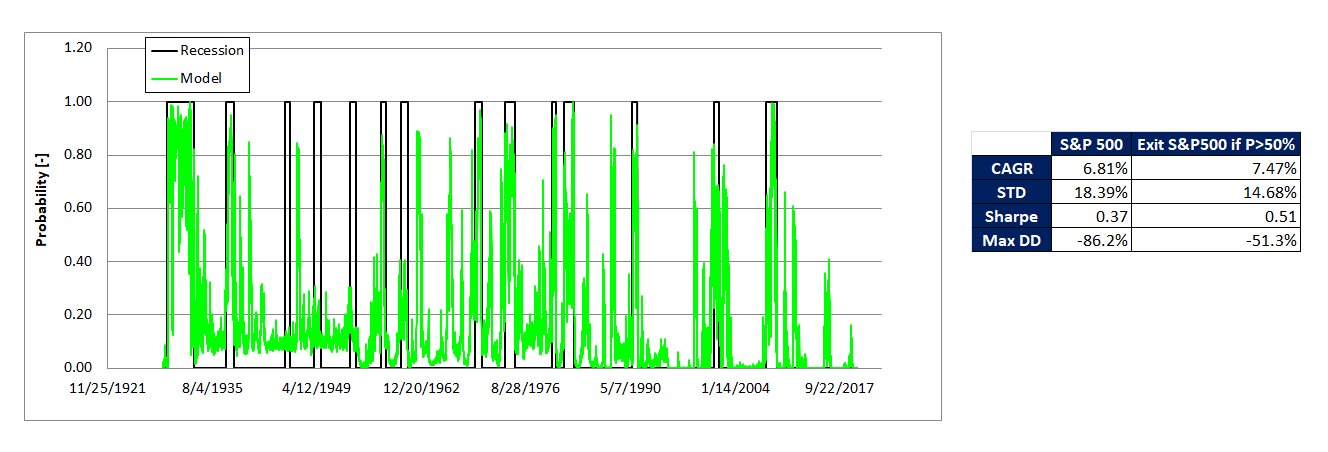
It has been a while since I wrote my last article. There has been hectic time with: work, Xmas break and developing AI based strategies applied to commodities and volatility products. As I am getting better and better in understanding advanced forms of AI and their potential, I told to myself why not to share with the community what it is and how I am applying it to our preferred strategy: NEXT-alpha. What is it? In computer science, artificial intelligence (AI), sometimes called machine intelligence, is intelligence demonstrated by machines, in contrast to the natural intelligence displayed by humans. Leading AI textbooks define it as any device that perceives its environment and takes actions that maximize its chance of successfully achieving its goals. Colloquially, the term "artificial intelligence" is often used to describe machines (or computers) that mimic "cognitive" functions that humans associate with the human mind, such as "learning" and "problem solving". The basic A typical AI analyzes its environment and takes actions that maximize its chance of success. An AI's intended goal can be as simple as: 1 if the AI wins a game, 0 otherwise, or complex such as repeat actions that have been successful in the past. AI often revolves around the use of algorithms. An algorithm is a set of unambiguous instructions that a mechanical computer can execute. Many AI algorithms are capable of learning from data; they can enhance themselves by learning new strategies, or "rules of thumb", that have worked well in the past. Alternatively in the most complex cases: they can themselves write other algorithms. Intelligent but not as human mind can do The cognitive capabilities of current architectures are very limited, using only a simplified version of what intelligence is really capable of. For instance, the human mind has come up with ways to reason beyond measure and logical explanations to different occurrences in life. In simpler words: humans can innovate and move beyond the status quo, machines can only move on a straight line and hardly make evolutionary innovations that goes beyond the current status of the world we live in. Does AI learn? Yes, it does. It does it continually and thus constantly improving its ability to take decisions and successfully execute a task. The computer algorithms automatically constantly improve based on what they learn on daily basis! How to apply this to finance? The equity market has existed for centuries, the future market for millennial (Yes! From the time of ancient Greece). Like Ray Dalio says understanding the mechanisms behind long and short term cyclicality of the market in its broader sense (stocks, bonds, metals,…) can help to forecast the most likely event to take place in the future. Now, once a mechanism is well understood, because it is a set of consecutive logical instructions, it can then be transformed in an algorithm, and once we have it in our hands we can then train it using a multitude of historical data that in some cases are tracing back to the beginning of 1900. With NEXT-alpha this is exactly what we are doing. We have used historical data to train our AI model to understand the most likely asset that is able to generate money in the next 1 to 3 months. Algorithms keep on evolving over time and so it was for NEXT-alpha. It went through some adjustments since it is inception back in 2017. The core principles are still there, the percentage of positive months and magnitude of returns keeps getting better and better. note: part of the article has been a re-edit from Wikipedia 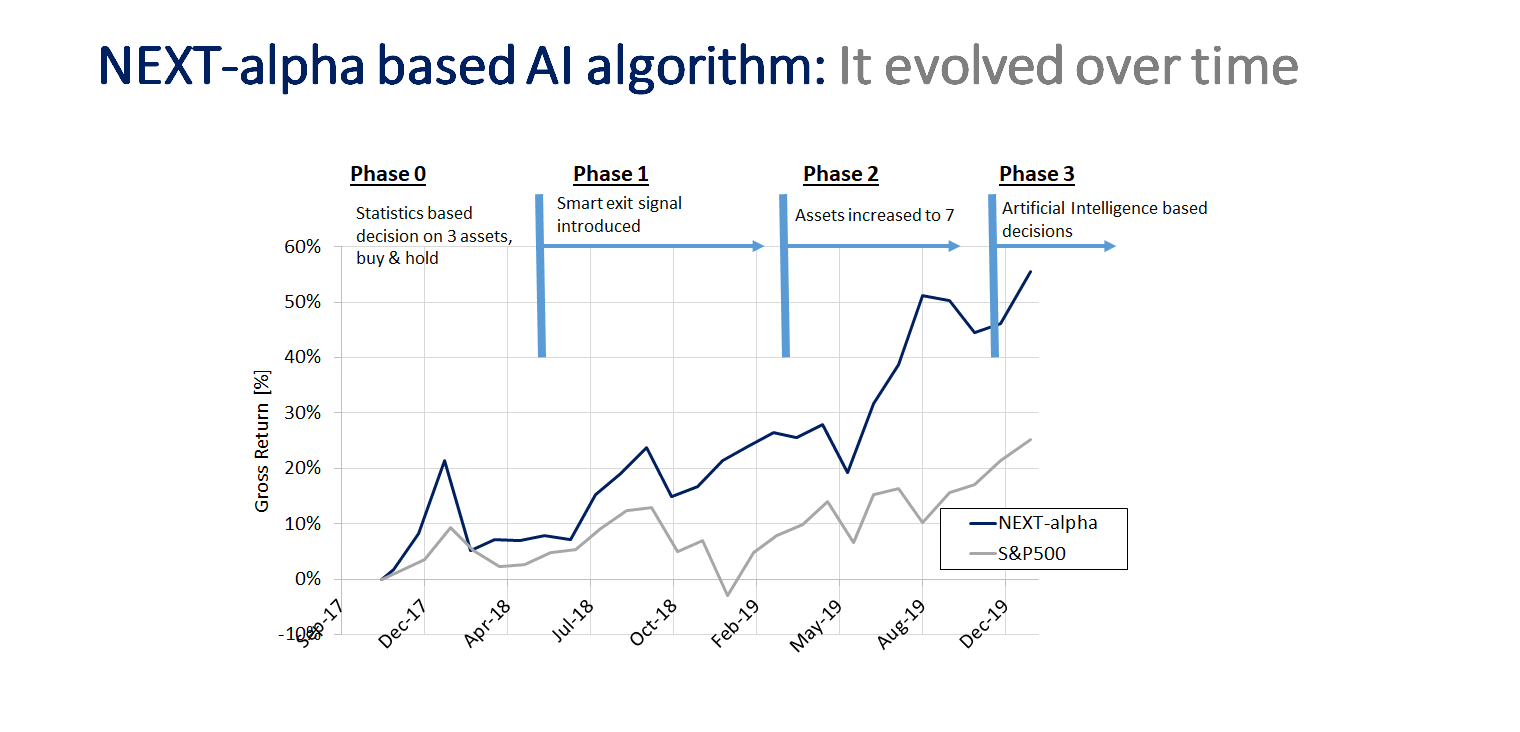 The short answer is yes (!) and of course there are some “but”. If on one hand, we do not need to be financial geniuses to do that on the other hand we need: discipline, planning and start as soon as we are born (parents need to do some planning as well). How to do that? Let’s start from the high level requirements. We are teens or less, we have not much money, let’s put this money to work in a passive managed index e.g. the S&P500. We have a bad crisis, money go down by 50-60%, we might not care much: all our life is in front of us, in absolute terms we are not losing much capital and we do not need this money right away. On the opposite side, let’s say we are 70 years old and we have just retired and we have to live out of our savings and we want our savings keep making money for us. Best place to invest them: short term bonds with a pay off of 2.1% per year and a max drawdown of 0.4%. In between these two extreme cases, we can think of allocating more and more money as we grow into bonds and less into e.g. the S&P500. Let’s now get down to some details and let’s do that in chronological order i.e. from when we are born until we are 100 years old. We are born and we get 1,000 USD and every year until we graduate from college at 25 y.o. we get in our saving account $500. We (our parents until we are 18 y.o.) take the money and invest them in the financial market, at the beginning 100% in the S&P500 and by age 25, 30% in bond and 70% in the S&P500. We then start working until we are 70. Because we are wise and we understand the importance of compounding, every year we incrementally add in our broker account some of our savings until the age of 70 in which we can comfortably put the equivalent of 2019 $12,000/year. By 2089, this should be 48,000 USD assuming 2% inflation per year. The money that we put on the broker account each year are invested in a combination of bonds and stocks as e.g. indicated in the table below according to a given age range. By 2089, we should have made $3.6M ($870,000 in 2019 money purchasing power). What next? We start enjoying our well deserved retirement spending 3-4,000 USD/month (2019 value) while investing all the remaining part in bonds giving us a steady 2%/year. It is not complicated to be a millionaire, it just requires some planning and discipline. This is what it can be achieved by using the S&P500 and simple bonds, we can then thinking of moving (wisely) to more sophisticated investment instruments and then we get the real deal! 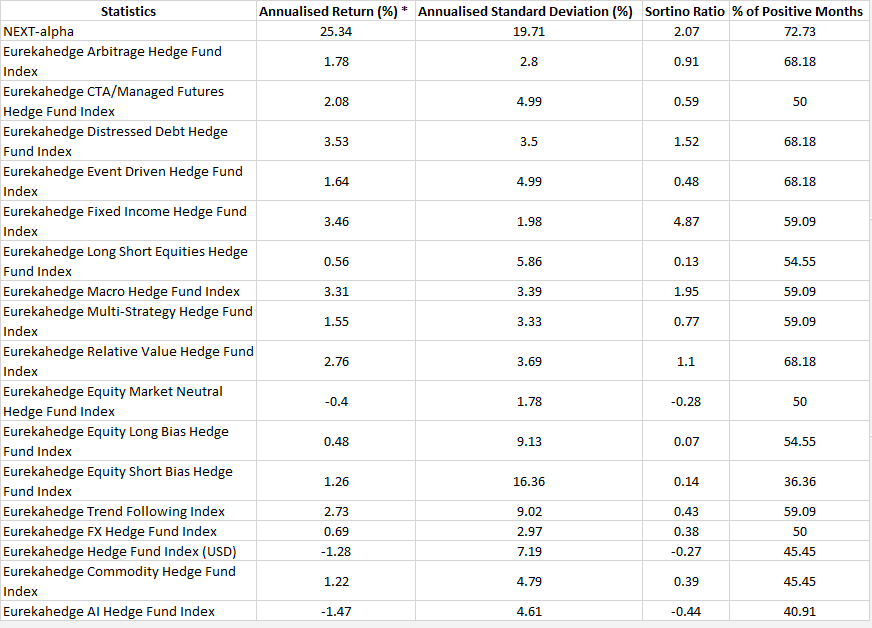 After having written about FOMO and the importance of an entry/exit strategy, it is now time to talk about how to build a portfolio. We all know that our portfolio should be diversified, but why? Fundamentally all of us are looking after maximizing the earnings while minimizing the risks. This can be effectively done by holding stocks, commodities and bonds. Easy, right? Yes, not a braniac. The question then become how much to allocate to each of the asset or strategy. We are now entering a trickier territory in which as investors we have to face the trade-off between risk and reward. We all want the strategy that in the long run gives the highest return (even knowing a priory the risk involved) but then in real life when we experience too much drawdown or a bad year we might rush into bad decisions such as revising our approach and thus ineffectively try to chase the tail. When it comes to portfolio optimization, I personally use two approaches: risk parity and the Markowitz approach. I ll spare the post from the mathematical details, if you want to know more either ask or Wikipedia has good enough info. I find the approaches complementary mostly because the risk parity might not always give the risk-reward profile we are after (despite being very easy to compute, not quite the same for the Markowitz). In the table below you can see how these two models are applied to a portfolio consisting of stocks (S&P500), gold and bonds (US medium term). The risk parity approach gives returns in between holding solely bonds or equities/gold while having low drawdown, higher Sharpe ratio and low correlation with the market. Using the Markowitz approach, while maximizing the Sharpe, the returns are as equities/gold while the maximum drawdown roughly half of what it is experienced in the last 15 years with these two assets. If on the other hand the drawdown is minimized then the results are very similar to the risk parity theory. Two approaches and three different answers: up to our risk appetite to decide what to follow. 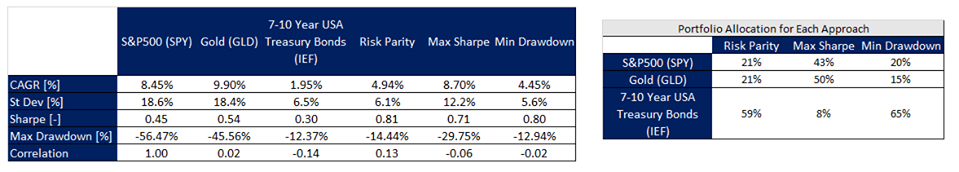 My previous post was about human psychology and how by nature people have the tendency to buy the highs and sell the lows. Let’s assume we have now managed to control our emotions and we are cold blooded investors capable to take rational decisions. As I see it, the next step in investing is to have a clear exit and entry plans. Instructions to write down to guide us prior pressing the sell or buy button on the screen. How to come up with these instructions? First we start from some hypothesis. After we have them clearly formulated, we verify through backtesting whether we are right, wrong or we have some fine tuning to do. We keep on adjusting the entry/exit hypothesis until the backtest is satisfactory enough so that the hypothesis now become our set of instruction to entry/exit an investment. Clear enough? If not or not enough, let me illustrate this process through an example. You might have noticed that once in a while the S&P500 drops by 3-4% and later there are usually three situations: go back up, move side ways and bloodshed. For simplicity, let’s imagine we are buy & hold investors. Allrighty, in the long term we’ll make money but… would do not be great if we could avoid major drawdowns (bloodshed). Definitely yes. Our hypothesis now become: I exit the trade when the market drop by a given % and I go back into the trade after a certain number of days. The hypothesis will become instructions only after the number of days and the % are properly specified and verified through backtesting. Next, take: Excel or Matlab or Python implement the optimization and backtesting routine and select the case that better suits your needs. In this example, using Matlab, I ran 732 simulations to optimize the entry/exit values for QLD (2x Nasdaq). As compared to a conventional buy & hold, the maximum drawdown can decrease from 84 to 47% while the CAGR from 26.7 to 28.8%. A couple of % points on CAGR might not seem that much but compounded over 13 years might mean more than double your returns. If you wonder about the optimized values for this specific case: 9.5% as trailback stop loss over a 35 days period (7 weeks). I hope you enjoyed reading this article. Next post will be about portfolio optimization. Drop a line if you have a specific example of portfolio you would like to optimize. In the meanwhile, wish you all a profitable week. 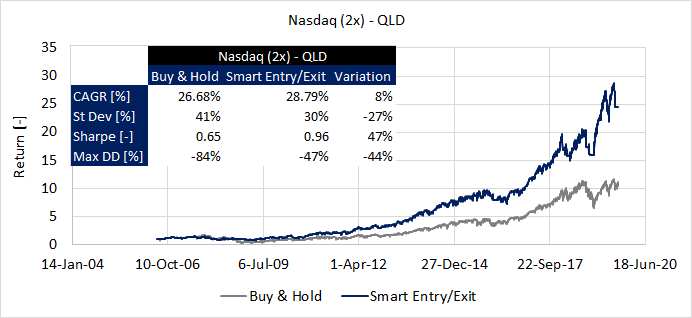 Since young age I have always been fascinated by philosophy and how human minds work. Even when facing the most unreasonable thoughts, digging deeper, there is (in the vast majority of the cases) a rationale behind. So, why do 75+% of the investors lose money? I can pin point at least three reasons: lack of strategy, poor portfolio asset allocation and emotions. In this post I’ll focus on the emotion part that quite often makes us (yes, I did several mistakes when I started) buying the highs and selling the lows. Buying low comes from an investment philosophy known as value investing. The basic concept of value investing is to buy investment instruments when they are “on sale.” That means buying when everyone else is selling (and prices are down) and vice versa. A smart value investor buys low, then patiently waits for the “herd” to catch up. Unfortunately, most investors tend to do the exact opposite: tend to chase trends and follow the herd. A huge part of smart investing is psychological and the image below (sorry for the quality) illustrates one of the many psychological roadblocks investors have. We may want to buy low and sell high, but that goes against our instincts and biases. When a stock/ETF is falling, we dump it. When a stock/ETF is rising, we buy it. We sell when the price is falling because we are afraid of losing more money; we buy when it is rising because we have a fear of missing out. To compound the problem, most investors are not experts at realizing when something high or low “enough.” So what to do to avoid the drawbacks of trying to buy low and sell high? • Understand your goals and risk tolerance: it is critically important to understand what it is you are trying to accomplish and how much risk you are comfortable taking. Once you have that figured out, you can create an investment plan that is appropriate for you and comfortable enough to keep you from impulse buying high and panic selling low. • Avoid market timing: instead of trying to time investments perfectly and squeeze every last cent out of each one, focus on building a diversified portfolio of stocks and bonds that give you the greatest chance to succeed over the long term. • Leverage your resources: having a great financial plan and a diversified portfolio is irrelevant if you don’t follow through and stick to it. Becoming self-aware of the pitfalls is a great first step Stay tuned for a couple of posts to come about: strategy definition and portfolio allocation. note: part of this post was originally posted on Investopedia 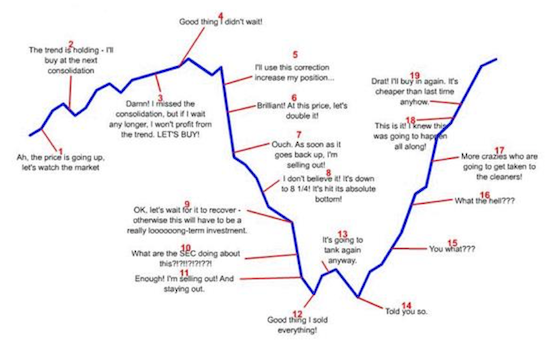 |
|
|
Questions?Contact us here.
DisclaimerThe information, analysis, data and articles provided in this and through this website are for informational purpose only. Nothing should be considered as an investment advice. Alpha Growth Capital does not make any recommendation to buy, sell or hold any security or position. The website and information provided through it are marketed “as is”. There is no guarantee that anything presented and provided on this and through this website is complete, accurate and correct. Relying on the information provided on this website and through its communication channels is done entirely at the individual own risk. There is no registration as investment advisor under any security law and nothing provided in this and through this website should be interpreted as a solicitation to buy, hold or sell any mentioned financial product or service. Past performance is not indicative of future results. Any financial decision is at the sole responsibility of the individual.
By navigating in this website, you agree to its Terms & Conditions |