ALPHA GROWTH CAPITAL
  • Home
  • Portfolio
  • Free Resources
    • Macro Economic Models ​
    • S&P500 Performance Indicator
    • Historical Data
    • AGC Monthly Newsletter
  • Join Us
  • Articles
  • Contact Us
  • Terms & Conditions

Sharing Our Thoughts

​THOUGHT ABOUT AN ENTRY & EXIT PLAN?

10/11/2019

Comments

 
My previous post was about human psychology and how by nature people have the tendency to buy the highs and sell the lows. Let’s assume we have now managed to control our emotions and we are cold blooded investors capable to take rational decisions. As I see it, the next step in investing is to have a clear exit and entry plans. Instructions to write down to guide us prior pressing the sell or buy button on the screen. 

How to come up with these instructions? First we start from some hypothesis. After we have them clearly formulated, we verify through backtesting whether we are right, wrong or we have some fine tuning to do. We keep on adjusting the entry/exit hypothesis until the backtest is satisfactory enough so that the hypothesis now become our set of instruction to entry/exit an investment.

Clear enough? If not or not enough, let me illustrate this process through an example.

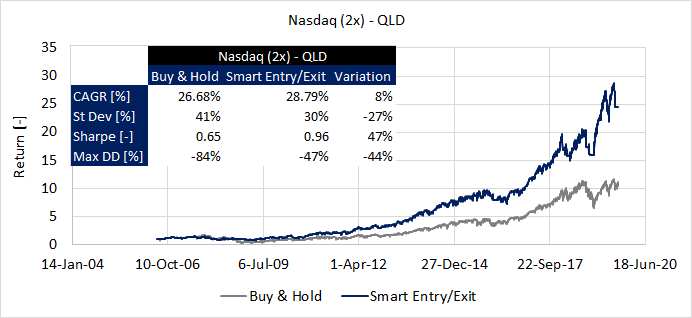
You might have noticed that once in a while the S&P500 drops by 3-4% and later there are usually three situations: go back up, move side ways and bloodshed. For simplicity, let’s imagine we are buy & hold investors. Allrighty, in the long term we’ll make money but… would do not be great if we could avoid major drawdowns (bloodshed). Definitely yes. Our hypothesis now become: I exit the trade when the market drop by a given % and I go back into the trade after a certain number of days. The hypothesis will become instructions only after the number of days and the % are properly specified and verified through backtesting. Next, take: Excel or Matlab or Python implement the optimization and backtesting routine and select the case that better suits your needs. In this example, using Matlab, I ran 732 simulations to optimize the entry/exit values for QLD (2x Nasdaq). As compared to a conventional buy & hold, the maximum drawdown can decrease from 84 to 47% while the CAGR from 26.7 to 28.8%. A couple of % points on CAGR might not seem that much but compounded over 13 years might mean more than double your returns. If you wonder about the optimized values for this specific case: 9.5% as trailback stop loss over a 35 days period (7 weeks).

I hope you enjoyed reading this article. Next post will be about portfolio optimization. Drop a line if you have a specific example of portfolio you would like to optimize.

In the meanwhile, wish you all a profitable week.
Picture
Comments

    ​Join our monthly newsletter, it is free!

    At the beginning of the month, we send out an email reviewing the performances of NEXT-alpha, provide our view of the economy based on our proprietary models and reviewing the current economic environment. ​
Subscribe to Newsletter

Questions?

Contact us here.

Disclaimer

The information, analysis, data and articles provided in this and through this website are for informational purpose only. Nothing should be considered as an investment advice. Alpha Growth Capital LLC does not make any recommendation to buy, sell or hold any security or position. The website and information provided through it are marketed “as is”. There is no guarantee that anything presented and provided on this and through this website is complete, accurate and correct. Relying on the information provided on this website and through its communication channels is done entirely at the individual own risk. The owner of Alpha Growth Capital is not a registered investment advisor under any security law and nothing provided in this and through this website should be interpreted as a solicitation to buy, hold or sell any mentioned financial product or service. Past performance is not indicative of future results. Any financial decision is at the sole responsibility of the individual.
​

By navigating in this website, you agree to its Terms & Conditions
​
  • Home
  • Portfolio
  • Free Resources
    • Macro Economic Models ​
    • S&P500 Performance Indicator
    • Historical Data
    • AGC Monthly Newsletter
  • Join Us
  • Articles
  • Contact Us
  • Terms & Conditions