ALPHA GROWTH CAPITAL
  • Home
  • Portfolio
  • Services
  • Free Resources
    • Macro Economic Models ​
    • S&P500 Performance Indicator
    • Historical Data
    • AGC Monthly Newsletter
  • Join Us
  • Articles
  • Contact Us
  • Terms & Conditions

Sharing Our Thoughts

Valuing Gold in the current market

18/9/2020

Comments

 
​Looking at the past
Historically gold coinage was widely used as currency. When paper money was introduced, it typically was a receipt redeemable for gold coin or bullion. In a monetary system known as the gold standard, a certain weight of gold was given the name of a unit of currency. For a long period, the United States government set the value of the US dollar so that one troy ounce was equal to $20.67, but in 1934 the dollar was devalued to $35.00 per troy ounce. On 17 March 1968, economic circumstances caused the collapse of the gold pool, and a two-tiered pricing scheme was established whereby gold was still used to settle international accounts at the old $35.00 per troy ounce but the price of gold on the private market was allowed to fluctuate; this two-tiered pricing system was abandoned in 1975 when the price of gold was left to find its free-market level. After 15 August 1971 Nixon shock, the price began to greatly increase, and between 1968 and 2000 the price of gold ranged widely. In late 2009, gold markets experienced renewed momentum upwards due to increased demand and a weakening US dollar. Gold further rallied hitting new highs in May 2010 after the European Union debt crisis prompted further purchase of gold as a safe asset [edited from: https://en.wikipedia.org/wiki/Gold#Price].

Why to value gold?
Gold is perceived as a safe asset to protect capital during: equities market downturns, periods of inflation and periods of stagflation. Understanding how its price might move in relationship to the equity market and inflation might help the investor to identify opportunities.

Modeling the gold price  
Traditionally commodities prices depend on the law of supply, demand and inventories. Too much supply and the price will go down and vice versa. When it comes to gold, the situation is somewhat different. Because gold is perceived as safe heaven against inflation and bad economy, its price is mostly affected by the valuation of the equity market, consumer price index and money in circulation (the last two directly proportional to the level of inflation).

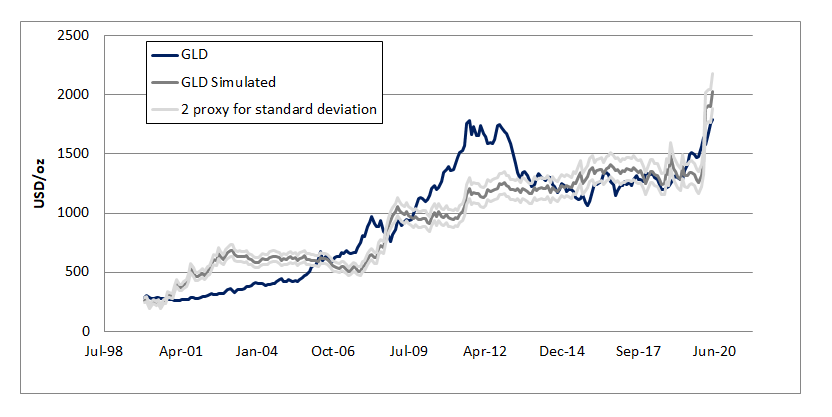
Regression was used to model the fair value of gold. Three inputs were used: S&P500 value, USA money stock and USA consumer price index. Regressing these three factors against monthly gold price, using more than 20 years of data, yields to a fairly good fit (i.e. 0.77 R2).
​
Like in the case of the S&P500 fair value model, we must keep in mind that these models are not predictive. An action must take place (i.e. actual value of the three inputs) for a reaction to happen (i.e. gold price).
Picture
The next question that comes to mind is: where is the gold price heading?
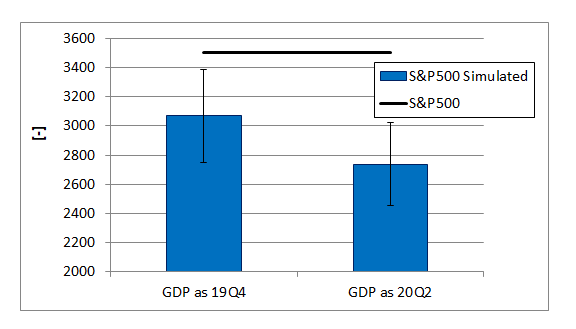
Because the gold price is affected by the equity market valuation, first we need to understand where the equity market might head. To do that, the model of the S&P500 presented in one of the Alpha Growth Capital previous articles is used.
​
From a fundamental perspective (GDP, CPI, money stock and corporate-treasure yield spread), the S&P500 looks to be overvalued between 14 and 28% (as per September the 1st). 28% assuming that the current USA GDP is the same as the one reported in 20Q2 while 14% assuming  the GDP being the same of 19Q4 (i.e. all the time high).
Picture
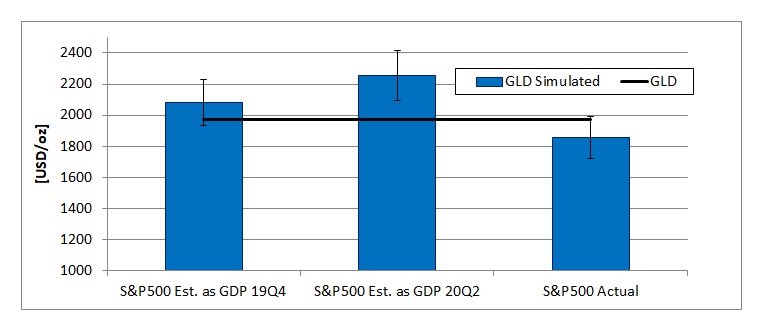
​Given that now we have an overview of where the market might be heading, the gold price can be estimated for three different scenarios. Using the current value of the S&P500 (September the 1st), according to this model, gold is somewhat overpriced by ca. 6%. In the eventuality, the market would move lower to its estimated value, the yellow metal might reach 2081-2255 USD/oz (ca. 5 to 12% higher than the current value).
Picture
​I hope the reader enjoyed the article. I would like to remind that this article is not an investment advice and there are no certainties that in the future the gold and S&P500 values will move as indicated by the models and presented in this post.
Comments

    ​Join our monthly newsletter, it is free!

    At the beginning of the month, we send out an email reviewing the performances of NEXT-alpha, provide the S&P500 and Gold outlooks based on our proprietary models and reviewing the current economic environment. ​
Subscribe to Newsletter

Subscription*​

Suitable for individuals that would like to implement the strategy themselves in their brokerage account.
​
It is only 37.5 USD/month! To subscribe Contact us!
​

Separately Managed Account

Suitable for investors with at least $20,000 to invest that would like Alpha Growth Capital to manage the asset on the client behalf.

Trades and performances are reported in real time, the client has the intraday liquidity, the funds are held with Exante and there is no lock-up period.

​Want to know more? Contact us!
​
SMAs are only provided to certain countries. 

The information, analysis, data and articles provided in this and through this website are for informational purpose only. Nothing should be considered as an investment advice. Alpha Growth Capital LLC does not make any recommendation to buy, sell or hold any security or position. The website and information provided through it are marketed “as is”. There is no guarantee that anything presented and provided on this and through this website is complete, accurate and correct. Relying on the information provided on this website and through its communication channels is done entirely at the individual own risk. The owner of Alpha Growth Capital is not a registered investment advisor under any security law and nothing provided in this and through this website should be interpreted as a solicitation to buy, hold or sell any mentioned financial product or service. Past performance is not indicative of future results. Any financial decision is at the sole responsibility of the individual.
​

By navigating in this website, you agree to its Terms & Conditions
​
  • Home
  • Portfolio
  • Services
  • Free Resources
    • Macro Economic Models ​
    • S&P500 Performance Indicator
    • Historical Data
    • AGC Monthly Newsletter
  • Join Us
  • Articles
  • Contact Us
  • Terms & Conditions