By Andrew White, CFA and Alpha Growth Capital LLCFYI - Article was written on June 1, 2020, so is now out of date. Despite the market gaining about +5% in the week following, article conclusions still largely hold. How to Value the Market Amid Economic Wipe-out? In normal times, measures such as P/E ratio, dividend yield, or other traditional metrics are widely used to value the stock market. In abnormal times – such as the ongoing global pandemic resulting in the effective shutdown of huge parts of the national economy – traditional measures fall short. For how can you value stocks normally when there is no way to reliably estimate earnings and share dilution? Over last 60 years though, one method stood the test of time that does not depend on traditional inputs: regression. It too requires inputs, but they are sometimes more discernible than traditional measures. To wit, just four inputs rationally predict S&P 500 fair value: Gross Domestic Product (GDP), Money Stock (M1), corporate bond spread, and CPI. And we think markets discount earnings? Regressing these four factors against the monthly level of S&P 500 since 1959 (i.e. 60 years of data) yields a model with exceptional fit (i.e. 0.96 R2), credibility across factors/model itself (i.e. high t-stats and F-factor significance), and correlation/coefficient alignment. In other words, it is not coincidence and includes a range measure capturing most history (i.e. proxy for 3x standard deviation of residuals): 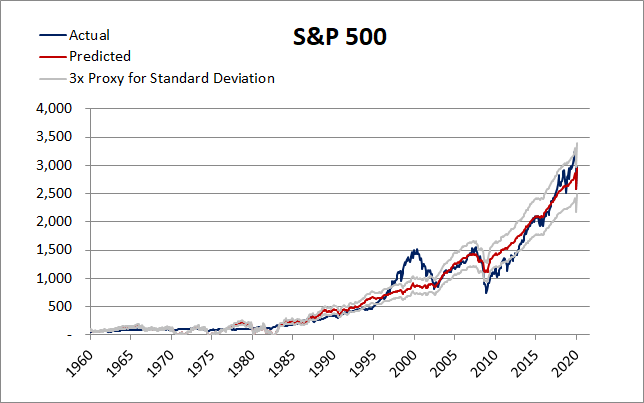 Fed Up
Given strong factor causation implied in the model above, it is natural to extrapolate the model forward to the end of 2020/beginning of 2021 amid the global lockdown to determine potential fair value level for the S&P 500. Amazingly, S&P 500 May-close value IS basically fair value re model (assumptions: -5% GDP, $6tn M1, 3% corp bond spread, -4% CPI over next 12 months). How? Federal intervention. Where does the market go from here then? To determine market trajectory, consider the future of Federal stimulus, given it was responsible for providing the bridge over 2020 valley. Considering a range of estimates for GDP, CPI, and corporate bond spread, it is possible to estimate how much money the Federal government must pump into the market/economy to obtain market highs (current M1 = $5tn): Scenario: V Economic Recovery The US economic machine effectively came to a near full stop for two months, now begins to re-open in a bumpy fashion, and the Federal Reserve does “what it takes” to permanently re-start the engine. Specifically, the following assumptions are made: ·12-month GDP change: -10% over next 12 months ·12-month Corporate - 10Y T-bond spread: 2.8% (long-term average + 1 standard deviation) ·12-month CPI change: -4% (maximum decline in 2008/09 economic contraction) ·12-month M1 level: $7.5tn (+$2.5tn more stimulus that translates down to M1 level) The question in this scenario is how much the federal government reacts, but react it is already clear they will. Exact level estimated is best left up to the stock market to predict. However, in this “V” scenario, the S&P500 is actually now 5% UNDER fair value (i.e. 3,200). If melt-up exuberance begins in earnest (i.e. valuation rises to proxy level for 3x standard deviation), S&P 500 has 20% upside to 3,600. Scenario: U or W Economic Recovery The economic recovery turns out to be deeper and more “U” or “W” as consumer spending does not return as fast as currently expected due to persistent unemployment and/or COVID 2nd wave. Thus, the Federal government and Federal Reserve inject vastly more stimulus. Specifically, the following assumptions are made: · 12-month GDP change: -15% over next 12 months · 12-month Corporate - 10Y T-bond spread: 4.4% (long-term average + 3 standard deviations) · 12-month CPI change: -8% (twice the maximum decline in 2008/09 economic contraction) ·12-month M1 level: $10tn (+$5tn more stimulus that translates down to M1 level) In short, bad - even horrific news - IS now a material positive for the S&P 500 as it effectively calls the federal government’s hand – in 2020 at least. In this “U or W” scenario then, the S&P500 is currently 10% UNDER fair value (i.e. 3,400). If a melt-up exuberance begins in earnest (i.e. valuation rises to proxy level for 3x standard deviation), S&P 500 has 30% upside to 4,000. Not a Question of Whether to Buy Right Now. Question is How Fast? According to our long-term regressed model for the S&P500, the S&P 500 incredibly is currently fairly valued. In an economic V recovery scenario, the market has potential for +5% to +20% upside all the way to 3,600. If an economic U or W recovery were to manifest, the S&P500 has potential for +10% to +30% upside all the way to 4,000. All…depending…on…the…federal…government. S&P 500 has risks: e.g. re-openings, earnings, China trade, COVID-19 2nd wave, election, and what comes after. Market valuation (currently or post-additional federal stimulus) though is NOT one. Indeed, material upside remains before valuation even becomes a concern, according to our regressed model. Little backstopped downside; meaningful future stimulus upside; wall of worry. Place your bets. |
|
|
Questions?Contact us here.
DisclaimerThe information, analysis, data and articles provided in this and through this website are for informational purpose only. Nothing should be considered as an investment advice. Alpha Growth Capital does not make any recommendation to buy, sell or hold any security or position. The website and information provided through it are marketed “as is”. There is no guarantee that anything presented and provided on this and through this website is complete, accurate and correct. Relying on the information provided on this website and through its communication channels is done entirely at the individual own risk. There is no registration as investment advisor under any security law and nothing provided in this and through this website should be interpreted as a solicitation to buy, hold or sell any mentioned financial product or service. Past performance is not indicative of future results. Any financial decision is at the sole responsibility of the individual.
By navigating in this website, you agree to its Terms & Conditions |