|
The first quarter of 2021 has been quite eventful. One of the situations that has somewhat shaken the equity market has been the rise in bond yields. More precisely the 10 year bond yield has been raised from 0.93% to 1.64%. There have been a large number of interviews in which it was stated that a rise in yield would have spelled the end of a rise of the equity market. Is this really true? Not in my opinion. The 10 years Treasury bond yields are loosely correlated with the equity market. Between 1960 and 2020, this correlation has been 5.35%. This loose correlation is more evident in Figure 1. In some years there is a positive strong correlation while in some others, the opposite happens. 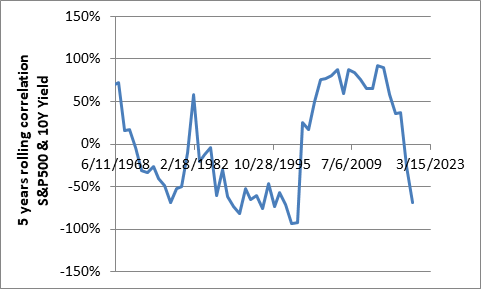 Figure 1: 5 years rolling correlation between the S&P500 and the 10Y Treasury bond yields. What should we really fear when it comes to yields? According to our S&P500 model (link to the article here), problems might start when the corporate bond yield increases much faster than the 10 years Treasury bond yield. All being equal, 1% point increase in spread between corporate and Treasury bond yield results in a 2.48% decrease in value of the S&P500; see Figure 2. Personally, I would rather track the evolution of this spread rather than the actual value of the Treasury bond yields. Investing in bonds could be convenient only if the yield is higher than the long term return of the S&P500; ca. 10%. From 1960 to today, this only happened between 1979 and 1985; link in here. 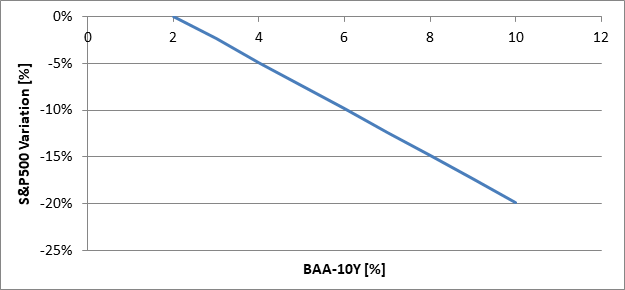 Figure 2: Relationship between the S&P500 and the corporate-Treasury bond yield spread. It is assumed that all the other macro-economic factors are constant. The second and not least important hot topic of 2020 and 2021 has been the money supply. 40% of all US dollars were printed in the last 12 months. What does that mean for the equity market? According to our S&P500 model, increasing the money supply (M1) results in an increase in value of the S&P500. For each 1 trillion dollar of additional money printed, all the rest been equal, we can expect a 6.96% increase of the S&P500; see Figure 3. This is assuming that the money that were printed will end up in the hands of business owners. 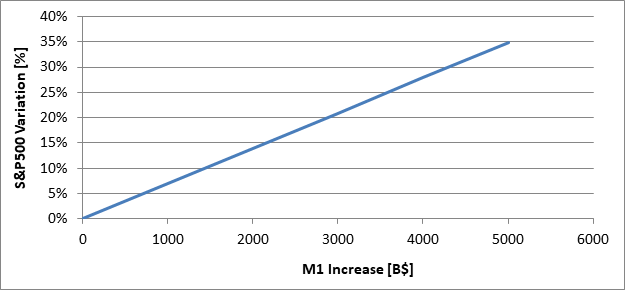 Figure 3: S&P500 variation as a function of the money supply (M1) increase. The situation could be somewhat different if the new money would reach the general public rather than business owners. This can lead to an increase in inflation. For each 1 trillion dollar of additional money printed, all the rest been equal, the consumer price index can be expected to rise by 7.45%; see Figure 4. With this happening, the S&P500 might experience and increase of 3.88% for each additional trillion of dollar printed. The increase in equity market value will not compensate for the increase in inflation. Even the money invested into the financial market will not be spared by inflation. 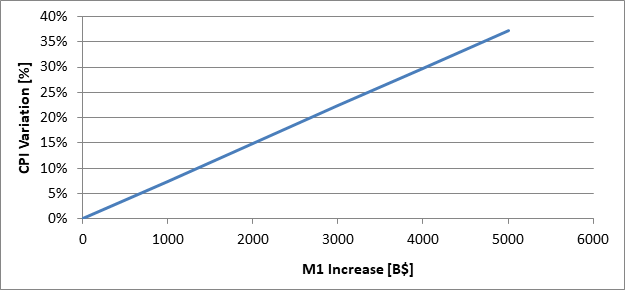 Figure 4: CPI variation as a function of the money supply (M1) increase. What is the tipping point? If the tipping point is defined as the percentage of money given to the general public when the increase in inflation is equal to the increase of the S&P500 then the tipping point is ca. 60%; see Figure 5. 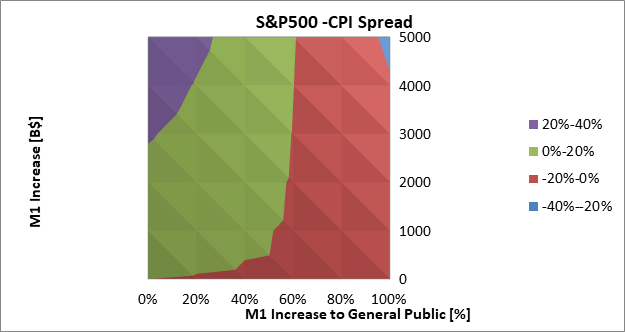 Figure 5: Spread between S&P500 and CPI as a function of the money supply increase and money provided to the general public.
We now might have a better understanding of the influence of yield spread and money supply on the equity market and consumer price index. There are lot of news out there that might induce fear and urge to change asset allocation. My advice is: take a step back, look at the situation as objectively as possible, filter the noise, look at similar past events and with the best analytical approach, take decisions as objectively as you can. |
|
|
Questions?Contact us here.
DisclaimerThe information, analysis, data and articles provided in this and through this website are for informational purpose only. Nothing should be considered as an investment advice. Alpha Growth Capital does not make any recommendation to buy, sell or hold any security or position. The website and information provided through it are marketed “as is”. There is no guarantee that anything presented and provided on this and through this website is complete, accurate and correct. Relying on the information provided on this website and through its communication channels is done entirely at the individual own risk. There is no registration as investment advisor under any security law and nothing provided in this and through this website should be interpreted as a solicitation to buy, hold or sell any mentioned financial product or service. Past performance is not indicative of future results. Any financial decision is at the sole responsibility of the individual.
By navigating in this website, you agree to its Terms & Conditions |