S&P500 Performance Indicator
The equity market moves, and from time to time a lot. The question is: how does the current movement compare to the historical movement of the equity market?
To answer to this question we have analyzed the average monthly variation of the S&P500 from 1900, both month over month and year to date.
To answer to this question we have analyzed the average monthly variation of the S&P500 from 1900, both month over month and year to date.
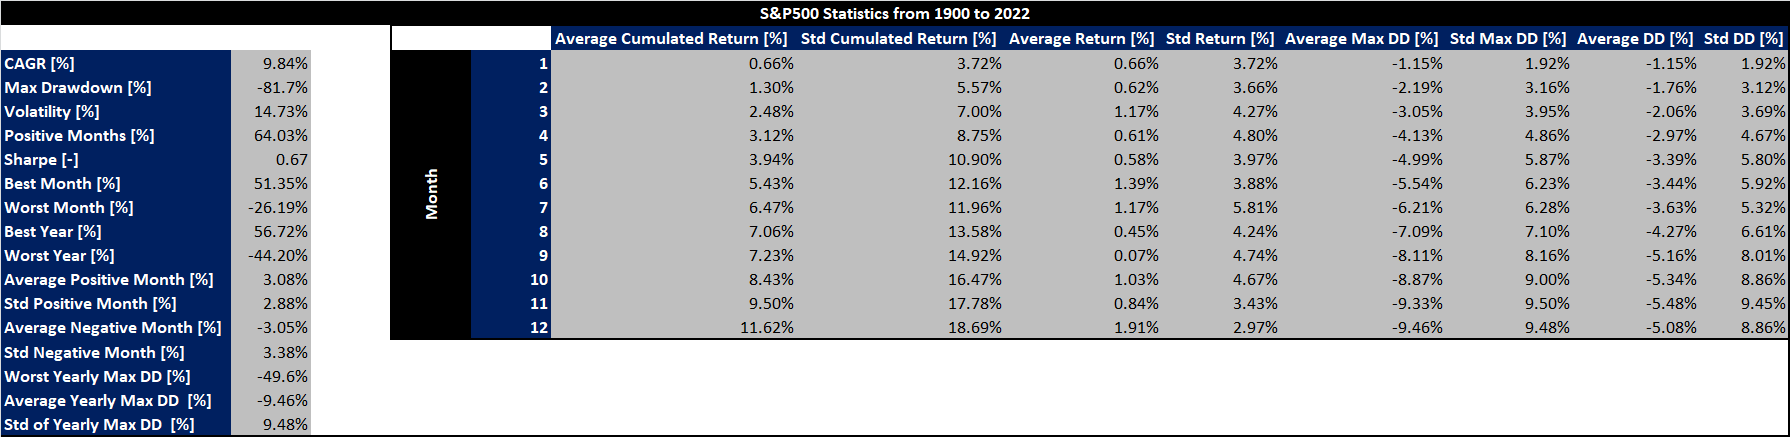
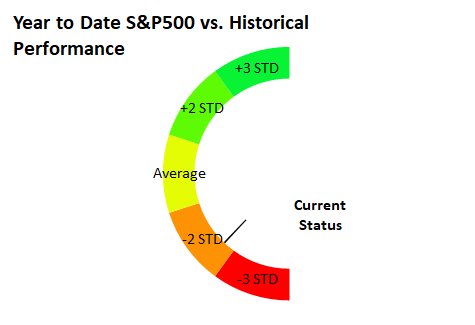
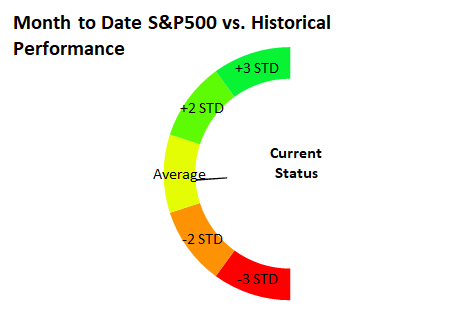
You can now compare the current market price variation (measured as S&P500) to its historical value and get a grip on where we are.
You can download this indicator free of charge by clicking the link below.
How is the market right now? Bullish? Bearish? Place your bet!
You can download this indicator free of charge by clicking the link below.
How is the market right now? Bullish? Bearish? Place your bet!
|
|
The indicator can be downloaded by clicking the link below:
|
By downloading the file, it is acknowledged that Alpha Growth Capital IS NOT RESPONSIBLE for: 1) any financial loss associated with the use of the indicator 2) the indicator accuracy
| ||
Disclaimer:
- Alpha Growth Capital is not responsible for any financial loss associated with the use of the files shared on this website.
- Please review the Terms & Conditions of the service before downloading; here.