ALPHA GROWTH CAPITAL
  • Home
  • Portfolio
  • Services
  • Free Resources
    • Macro Economic Models ​
    • S&P500 Performance Indicator
    • Historical Data
    • AGC Monthly Newsletter
  • Join Us
  • Articles
  • Contact Us
  • Terms & Conditions

Sharing Our Thoughts

An Effective Approach to Stock Picking

18/3/2021

Comments

 
In this article we propose a methodology to pick-up stocks. The method consists in creating a portfolio of 10 stocks. The stocks can be taken from the components of the S&P500 or Nasdaq 100. The securities are selected based on their return of investment over a certain number of months. Six months if the stocks come from the S&P500 components while three months if they are from the Nasdaq 100. The stocks are then hold 10 days if they are selected from the S&P500 constituents or six months if they are taken from the Nasdaq 100’s basket.

Selecting stocks can be a very complex and time consuming task. Even when automatized, valuing a company can be a challenge and the return of investment on a company can be heavily influenced by the sentiment of the market. GameStop can be a textbook example of this situation. In this article we propose a methodology in which a portfolio of stocks is selected based on their past returns. The method is made of three parameters that have to be optimized in order to maximize the portfolio return with an acceptable maximum drawdown. These variables are:

  1. Number of stocks in the portfolio. 10 to 50 were used in the optimization routine.
  2. Look back period in which the return of each stock is calculated. 5 days, 10 days, 1 month, 3 months and 6 months were evaluated.
  3. Duration to hold a portfolio prior a new reshuffle is done. 5 days, 10 days, 1 month, 3 months and 6 months were considered.
The stocks were selected using two baskets: the S&P500 and Nasdaq 100 components. Two optimizations were done for each of the basket. The backtest optimization was done using the last 20 years of data.
​
Selecting Stocks Using the S&P500 Components
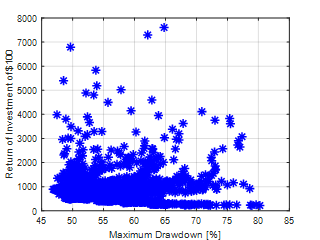
In Figure 1 the return of investment as function of the maximum drawdown is presented. The lowest maximum drawdown is ca. 46-47% which is not substantially lower than buying and holding the S&P500; ca. 57% in the last 20 years. The return on investment can be highly amplified using this stock picking methodology. In the best case, the highest annualized return of investment with a maximum drawdown not exceeding 50%, is 33.32% vs. 8.77% of the S&P500.
Picture
Figure 1: Return of investment as function of the maximum drawdown for all the runs using the S&P500 components.

Increasing the CAGR by 3.8 times can be done with:
  • Having a portfolio of 10 stocks
  • Selecting the stocks with the highest returns for the last 6 months
  • Holding these stocks for 10 working days (2 weeks)
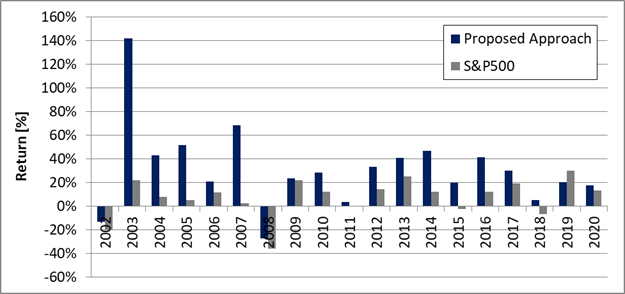
Table 1 and Figure 2 are summarizing the key statistics and annualized returns of the proposed approach and the S&P500.
​
Table 1: key statistics of the proposed stock picking approach and the S&P500.
Picture
Picture
Figure 2: Annualized returns of the proposed stock picking approach and the S&P500.
​
Selecting Stocks Using the Nasdaq 100 Components
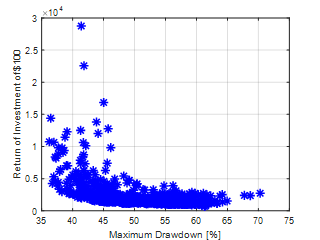
Figure 3 shows the return of investment as function of the maximum drawdown. The lowest maximum drawdown is ca. 35% which is lower than buying and holding the Nasdaq 100; ca. 56% in the last 20 years. Assuming we try to maximize the return of investment with a maximum drawdown lower than 50% then this methodology allows achieving an annualized return of 41.79% vs. the 12.97% of the Nasdaq 100.
Picture
Figure 3: Return of investment as function of the maximum drawdown for all the runs using the Nasdaq 100 components.

Increasing the CAGR by 3.2 times can be done with:
  • Having a portfolio of 10 stocks
  • Selecting the stocks with the highest returns for the last 3 months
  • Holding these stocks for 6 months
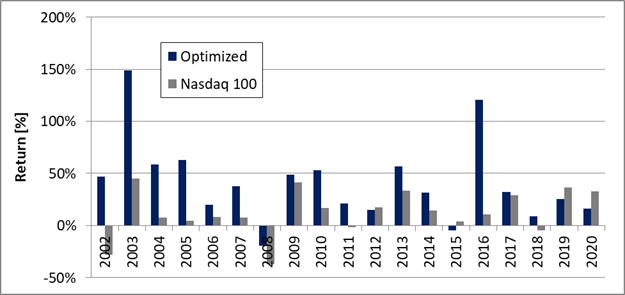
Table 2 and Figure 4 are summarizing the key statistics and annualized returns of the proposed approach and the Nasdaq 100.
​
Table 2: key statistics of the proposed stock picking approach and the Nasdaq 100.
Picture
Picture
Figure 4: Annualized returns of the proposed stock picking approach and the Nasdaq 100.

Comparing to Berkshire Hathaway
One of the greatest stock pickers of all the time is Warren Buffet, how would this methodology compare to the returns of Berkshire Hathaway? The answer is provided in Table 3 and Figure 5. Despite this strategy hypothetically behaves better than the performances of Berkshire Hathaway, it is important to keep in mind that these conclusions were drawn assuming that there is no bottle neck with this strategy in the ability to purchasing whatever stock.
​
Table 3: key statistics of the proposed stock picking approaches, Berkshire Hathaway and the reference indexes.
Picture
Picture
Figure 5: Annualized returns of the proposed stock picking approaches, Berkshire Hathaway and the reference indexes.

Stock picking can be a very complex and tedious work to perform. In this article, it was proposed a methodology to select stocks based on the company momentum. The optimal number of stocks and holding duration was also discussed. The methodology allows increasing the annualized returns by 3.2-3.8 times versus the benchmark indexes while keeping the maximum drawdown below 50%.
Comments

    ​Join our monthly newsletter, it is free!

    At the beginning of the month, we send out an email reviewing the performances of NEXT-alpha, provide the S&P500 and Gold outlooks based on our proprietary models and reviewing the current economic environment. ​
Subscribe to Newsletter

Subscription*​

Suitable for individuals that would like to implement the strategy themselves in their brokerage account.
​
It is only 37.5 USD/month! To subscribe Contact us!
​

Separately Managed Account

Suitable for investors with at least $20,000 to invest that would like Alpha Growth Capital to manage the asset on the client behalf.

Trades and performances are reported in real time, the client has the intraday liquidity, the funds are held with Exante and there is no lock-up period.

​Want to know more? Contact us!
​
SMAs are only provided to certain countries. 

The information, analysis, data and articles provided in this and through this website are for informational purpose only. Nothing should be considered as an investment advice. Alpha Growth Capital LLC does not make any recommendation to buy, sell or hold any security or position. The website and information provided through it are marketed “as is”. There is no guarantee that anything presented and provided on this and through this website is complete, accurate and correct. Relying on the information provided on this website and through its communication channels is done entirely at the individual own risk. The owner of Alpha Growth Capital is not a registered investment advisor under any security law and nothing provided in this and through this website should be interpreted as a solicitation to buy, hold or sell any mentioned financial product or service. Past performance is not indicative of future results. Any financial decision is at the sole responsibility of the individual.
​

By navigating in this website, you agree to its Terms & Conditions
​
  • Home
  • Portfolio
  • Services
  • Free Resources
    • Macro Economic Models ​
    • S&P500 Performance Indicator
    • Historical Data
    • AGC Monthly Newsletter
  • Join Us
  • Articles
  • Contact Us
  • Terms & Conditions