ALPHA GROWTH CAPITAL
  • Home
  • Portfolio
  • Services
  • Free Resources
    • Macro Economic Models ​
    • S&P500 Performance Indicator
    • Historical Data
    • AGC Monthly Newsletter
  • Join Us
  • Articles
  • Contact Us
  • Terms & Conditions

Sharing Our Thoughts

Forget Time, Focus on Volatility

16/12/2020

Comments

 
All of us are very familiar with the concept of time because this is something we experience on daily basis since the time we were born. As result when we deal with financial time series and we try to optimize them to reach our targeted CAGR, maximum drawdown,… we do that in the time domain. We download data from e.g. Yahoo Finance, we get our nice spreadsheet which is basically a series of data sampled on daily basis and then we work on it.

With this article I would to show that there is a better way to optimize financial time series. I’ll do that with a case study about optimizing the daily stop loss value of the Nasdaq 100. In this example I have used the ETF QQQ.

First: forget looking at the price action in the time domain. Second: start looking at the price action in the volatility domain. When I talk of volatility, I am referring to the S&P500 volatility which is typically measured with the CBOE Volatility Index (VIX).

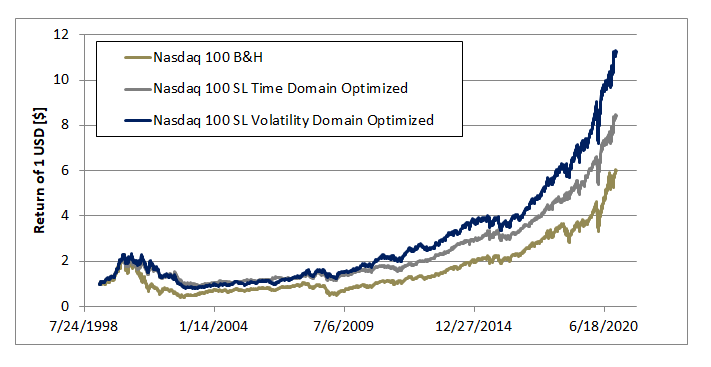
Let’s start with the case study. The research question is: what is the best stop loss to maximize the CAGR of the Nasdaq 100 (QQQ)? What most of the people would do is to find a single stop loss (SL) value to maximize the CAGR of the time series. When doing so, I get 0% as the most appropriate SL. This means that as soon as the daily price variation becomes negative or the market opens below the previous close then the strategy is in cash until the position is re-opened at the end of the trading day. With this approach, the CAGR increases from 8.53% to 10.23% while the maximum drawdown is reduced from 83 to 60%. Not too bad. Let me tell you that there is a better way to do that. This is by looking at the price action in the volatility domain.

We can think of dividing the VIX in three equally spaced ranges; low, medium and high. For each of these ranges there is a daily price action associated with the Nasdaq. We can now think of optimizing the SL value for each of the volatility range. It might get somewhat complicated in Excel but it is worth the effort. If we do that, the optimal SL values are: 2, 1 and 0% for the low, medium and high volatility range respectively. The optimized time series will now have a CAGR of 11.67% while a drawdown of 66%. The CAGR increase by 3.14% points vs. the baseline case. This might not seem much but over a 20 years investment period this means to nearly double the returns at the end of this 20 years’ time.
​
The key statistics and time series for these three different investment approaches are presented in Table 1 and Figure 1 respectively.
Picture
Figure 1: time series for the three different investment approaches.
​

Table 1: key statistics for the three different investment approaches.
Picture
​It is clearly advantageous to look at the price action in the volatility domain. Optimizations can take place in several shapes like e.g. looking at minimizing the max drawdown or finding the highest CAGR for a targeted max drawdown or splicing time series depending on the volatility level. In this article for simplicity we just looked into maximization of the CAGR but I ensure you that there is much more that can be done.
Comments

    ​Join our monthly newsletter, it is free!

    At the beginning of the month, we send out an email reviewing the performances of NEXT-alpha, provide the S&P500 and Gold outlooks based on our proprietary models and reviewing the current economic environment. ​
Subscribe to Newsletter

Subscription*​

Suitable for individuals that would like to implement the strategy themselves in their brokerage account.
​
It is only 37.5 USD/month! To subscribe Contact us!
​

Separately Managed Account

Suitable for investors with at least $20,000 to invest that would like Alpha Growth Capital to manage the asset on the client behalf.

Trades and performances are reported in real time, the client has the intraday liquidity, the funds are held with Exante and there is no lock-up period.

​Want to know more? Contact us!
​
SMAs are only provided to certain countries. 

The information, analysis, data and articles provided in this and through this website are for informational purpose only. Nothing should be considered as an investment advice. Alpha Growth Capital LLC does not make any recommendation to buy, sell or hold any security or position. The website and information provided through it are marketed “as is”. There is no guarantee that anything presented and provided on this and through this website is complete, accurate and correct. Relying on the information provided on this website and through its communication channels is done entirely at the individual own risk. The owner of Alpha Growth Capital is not a registered investment advisor under any security law and nothing provided in this and through this website should be interpreted as a solicitation to buy, hold or sell any mentioned financial product or service. Past performance is not indicative of future results. Any financial decision is at the sole responsibility of the individual.
​

By navigating in this website, you agree to its Terms & Conditions
​
  • Home
  • Portfolio
  • Services
  • Free Resources
    • Macro Economic Models ​
    • S&P500 Performance Indicator
    • Historical Data
    • AGC Monthly Newsletter
  • Join Us
  • Articles
  • Contact Us
  • Terms & Conditions