ALPHA GROWTH CAPITAL
  • Home
  • Portfolio
  • Services
  • Free Resources
    • Macro Economic Models ​
    • S&P500 Performance Indicator
    • Historical Data
    • AGC Monthly Newsletter
  • Join Us
  • Articles
  • Contact Us
  • Terms & Conditions

Sharing Our Thoughts

Hedging with Long Volatility Positions

30/3/2021

Comments

 
When it comes about protecting the portfolio during downturns, I often I read about diversification either using a combination of uncorrelated asset classes or through equities ETFs that cover different regions of the World.

Does it really work?
​
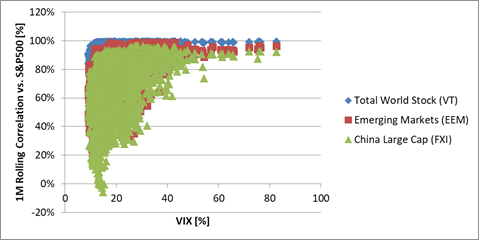
When sell-offs start and the fear gauge (VIX, the volatility index) spikes, all of a sudden loosely correlated equities ETFs become correlated; see Figure 1. This means that if the broad market goes down and the correlation is nearly 100% then all the rest goes down. Diversifying through equities ETFs that cover different regions of the World is not really helping when we need it the most. The same is true when diversification is done across different sectors.
Picture
Figure 1: 1 month rolling correlation between the S&P500 and three others equities ETFs.

How about diversifying using different asset classes?

If we thing about investing in gold, medium term bonds (e.g. IEF) and equities (e.g. SPY) and allocate capital based on the risk parity methodology, definitely the maximum drawdown is reduced during downturns. For instance when in 2020 Q1, the S&P500 went down by nearly 35%, this allocation would have experienced a maximum drawdown lower than 7%. Unfortunately everything has a cost and this strategy has the drawback of very low annualized return: 3.36% vs. the 15.52% of the S&P500 (2009-2021).  

What to do about this? Can we break the trade-off between annualized return and the maximum drawdown?
​
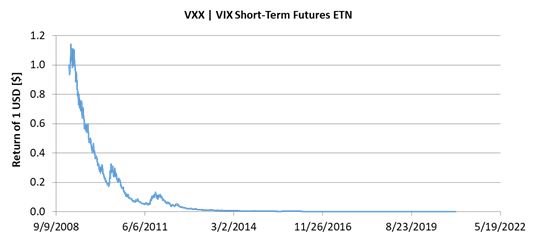
VXX, the VIX short term future ETN, might do the trick and help out our portfolio. By the way it was designed, VXX decays over time. Buying and Holding this ETN is a financial suicide; see Figure 2. The good news is that when the market crashes, this ETN spikes in value. For instance between February and March 2020, in the panic of the pandemic, VXX increased by 436% while the S&P500 dropped by 35%. 
Picture
Figure 2: Buying and holding VXX.

How to take advantage of these spikes?

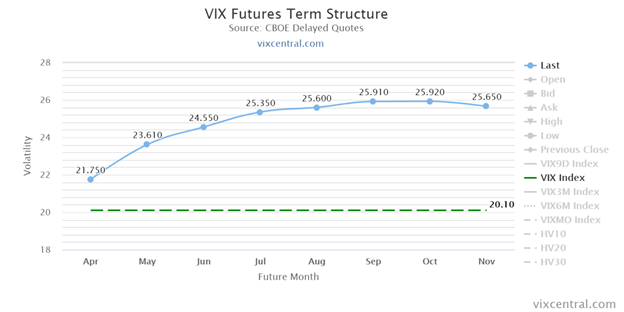
The first thing to do is to understand when to enter a long position in VXX. To do that we must look at the VIX term structure. This chart can be found on vixcentral.com and is shown in Figure 3. Each dot represents a VIX future value while the dashed line represents the VIX spot price. If all the future contracts values are pointing upwards and the spot VIX is below the futures then no major sell-off can be expected. Troubles can be expected when the first front two months are ca. 10% below the VIX spot value. If this happens, it is highly probable that a major sell-off is underway and it will continue even stronger in the next few days. When this happens then the VXX ETN spikes quite rapidly.  For the sake of brevity, lot of information on how to read the VIX term structure have been omitted. 
Picture
Figure 3: The VIX term structure on March the 29th 2021.

By knowing that the VXX spikes when the first two front months are ca. 10% below the VIX spot price, assuming our portfolio is made 100% of equities, then we can think of taking part of it and allocating it to a long volatility position.

Table 1 shows the CAGR and maximum drawdown as function of the percentage of the portfolio allocated to a long volatility position. It is assumed that the investor sells all the equities positions as soon as the first two front futures are 10% below the spot price. In this example, it is  assumed that the equities are represented by the S&P500.
​
Table 1: annualized return of investment and maximum drawdown as function of the portfolio allocation to a long volatility trade.
Picture
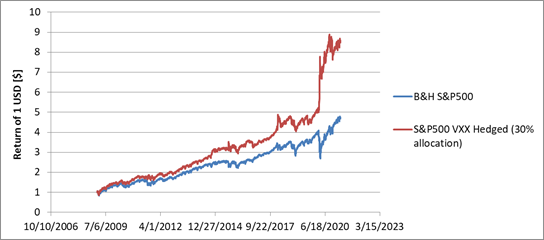
​By allocating 30% of the portfolio to a long volatility trade is effective in maximizing the annualized return while minimizing the drawdown. In the same period, buying and holding the S&P500 would have resulted in an annualized return of 15.3% and a maximum drawdown of 34%. The backtest of this optimal case is shown in Figure 4.
Picture
Figure 4: Equities portfolio hedged with a long VXX position versus buying and holding equities.

In conclusion, diversification is not protecting our portfolio when we need it the most. Equities become all correlated when the market goes down. Diversifying using different asset classes can reduce the drawdown but the long term return is penalized. By wisely opening long volatility positions when the equity market sinks can provide an effective hedge to reduce the maximum drawdown while improving the annualized returns.
Comments

    ​Join our monthly newsletter, it is free!

    At the beginning of the month, we send out an email reviewing the performances of NEXT-alpha, provide the S&P500 and Gold outlooks based on our proprietary models and reviewing the current economic environment. ​
Subscribe to Newsletter

Subscription*​

Suitable for individuals that would like to implement the strategy themselves in their brokerage account.
​
It is only 37.5 USD/month! To subscribe Contact us!
​

Separately Managed Account

Suitable for investors with at least $20,000 to invest that would like Alpha Growth Capital to manage the asset on the client behalf.

Trades and performances are reported in real time, the client has the intraday liquidity, the funds are held with Exante and there is no lock-up period.

​Want to know more? Contact us!
​
SMAs are only provided to certain countries. 

The information, analysis, data and articles provided in this and through this website are for informational purpose only. Nothing should be considered as an investment advice. Alpha Growth Capital LLC does not make any recommendation to buy, sell or hold any security or position. The website and information provided through it are marketed “as is”. There is no guarantee that anything presented and provided on this and through this website is complete, accurate and correct. Relying on the information provided on this website and through its communication channels is done entirely at the individual own risk. The owner of Alpha Growth Capital is not a registered investment advisor under any security law and nothing provided in this and through this website should be interpreted as a solicitation to buy, hold or sell any mentioned financial product or service. Past performance is not indicative of future results. Any financial decision is at the sole responsibility of the individual.
​

By navigating in this website, you agree to its Terms & Conditions
​
  • Home
  • Portfolio
  • Services
  • Free Resources
    • Macro Economic Models ​
    • S&P500 Performance Indicator
    • Historical Data
    • AGC Monthly Newsletter
  • Join Us
  • Articles
  • Contact Us
  • Terms & Conditions