|
Leveraged Exchange Traded Products (ETPs) need to be resetted on daily basis to deliver a percentage move that is a positive or negative multiple of an underlying security’s percentage price movement. In 2019 Matthew Crouse highlighted a side effect of this rebalancing process: a price drag that is proportional to the leverage factor and volatility of the underlying asset (link to the paper here). Crouse estimated that the resulting drag on the Compounded Annual growth Rate (CAGR) of the leveraged ETPs can be estimated as: L*(L-1)*0.5*sigma^2. L is the leverage factor while sigma is the annualized volatility of the reference security. Figure 1 shows the CAGR drag as function of a hypothetical ETP leverage factor at 15% annualized volatility. From the chart, we can make two observations:
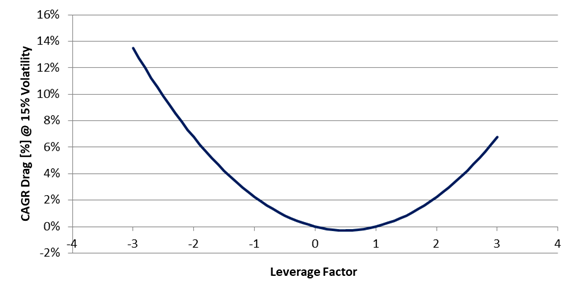 Figure 1: Theoretical CAGR drag as function of a hypothetical ETP leverage factor at 15% volatility. These two observations might result in an opportunity for a potential profit. In the first case, we can think of simultaneously shorting two ETPs having opposite leverage factor while in the second case we can think of selling the underlying asset while buying twice the share of an instrument deleverage by 0.5. How big is this opportunity? Case1: Shorting ETPs with opposite leverage factor Let’s start from a theoretical case study. For this example I have chosen a leverage factor of 3. First, we can find on the market several ETPs being leveraged by plus/minus 3. Second, the higher is the leverage factor the higher is the CAGR drag differential between the positive and the negative leveraged instrument. The opportunity is presented in Figure 2. The opportunity is independent of the CAGR of the underlying asset while it grows with assets having high volatility. 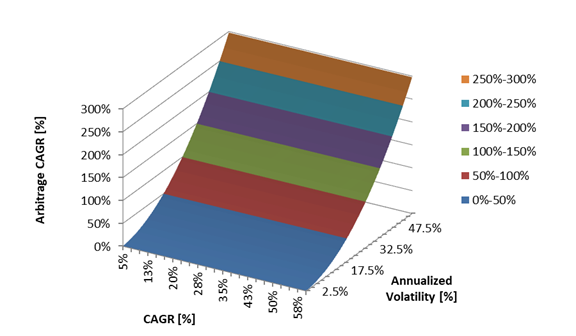 Figure 2: Theoretical CAGR of simultaneously shorting two ETPs with a leveraged factor of +3x and -3x as function of the CAGR and Annualized volatility of the underlying asset. Let’s now move on to a backtest using TQQQ and SQQQ. These two products are the 3x and -3x leveraged versions of QQQ. QQQ is an ETP that replicates the behavior of the Nasdaq 100 index. The results are shown in Figure 3. The CAGR was estimated to be 3.68%, the maximum drawdown 2.63% and the Sharpe ratio 1.35. On a risk adjusted basis, the results are not bad. Since 2009, the Nasdaq 100 had a CAGR of 17%, Sharpe 0.75 and maximum drawdown of 54%. 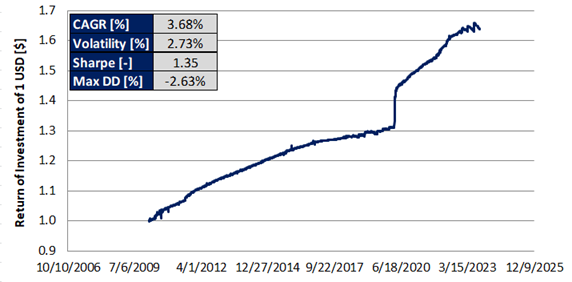 Figure 3: Backtest from simultaneously shorting TQQQ and SQQQ. Case2: Shorting the underlying asset while going long twice on the 0.5x leveraged ETP As in the previous case, let’s start from a theoretical case study. According to the theory, the highest CAGR boost is achieved with a deleverage factor of 0.5. We now use this factor to compute the CAGR as function of the CAGR and annualized volatility of a hypothetical underlying asset. The results are presented in Figure 4. Like in the previous case, the outcome is independent of the CAGR of the underlying ETP while the higher is the volatility the higher the opportunity. 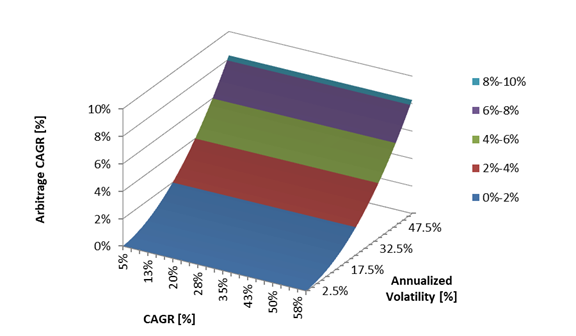 Figure 4: Theoretical CAGR of simultaneously shorting a reference asset while going twice long on its 0.5x leverage version. There are not many deleveraged products on the market to perform a backtest. At the moment of writing SVXY is (with some minor differences) the deleveraged version of SVIX. Unfortunately SVIX is a little bit older than 1 year and as result the backtest might not provide a full picture of what might happen over several different market conditions. The results are presented in Figure 5. With this approach, we get a CAGR of 6.83%, Sharpe ratio of 0.97 and a maximum drawdown of 4.67%. 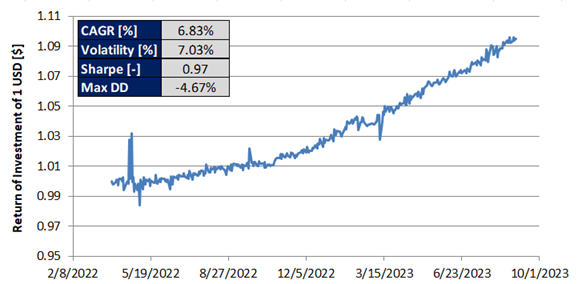 Figure 5: Backtest from shorting the reference asset (SVIX) while going twice long on the deleverage asset (SVXY). It is important to keep in mind that whether Case 1 or Case 2 is implemented, the portfolio need to be rebalanced on daily basis. Failure to rebalance the portfolio to compensate for the ETPs daily price action will result in an outcome very different from what it can be expected. When the market trends upward, performance can be exceptional. When the market trends downward, lot of drawdown can be expected. This is illustrated in Figure 6 using as example TQQQ and SQQQ. Very few if no-one would have the stomach to digest 80% drawdown. 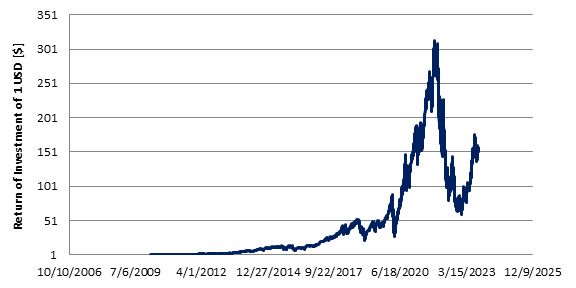 Figure 6: Backtest from simultaneously shorting TQQQ and SQQQ without rebalancing the portfolio on daily basis. Source: author.
In conclusion, the CAGR drag resulting from the rebalance of leveraged ETPs might create a couple of arbitrage opportunities. The CAGR of these two opportunities increase with assets that are volatile. In this article we have evaluated two case studies and their profit potential. It is important to keep in mind that very rarely we have free lunches and there are risks associated with the strategies described in this article. First when shorting an asset, we are not in control of it. Our short position can be called anytime while we might keep holding the other side of the trade. Second, there might be occasions when we are not allowed to close one of both side of the trade. Usually these things happen when things go south. Last, dealing with leveraged ETPs is very risky. Not knowing exactly how these products function might result in major losses. |
|
|
Questions?Contact us here.
DisclaimerThe information, analysis, data and articles provided in this and through this website are for informational purpose only. Nothing should be considered as an investment advice. Alpha Growth Capital does not make any recommendation to buy, sell or hold any security or position. The website and information provided through it are marketed “as is”. There is no guarantee that anything presented and provided on this and through this website is complete, accurate and correct. Relying on the information provided on this website and through its communication channels is done entirely at the individual own risk. There is no registration as investment advisor under any security law and nothing provided in this and through this website should be interpreted as a solicitation to buy, hold or sell any mentioned financial product or service. Past performance is not indicative of future results. Any financial decision is at the sole responsibility of the individual.
By navigating in this website, you agree to its Terms & Conditions |